


Channel trading strategy is a classic form of trading in both Forex and binary options. This is a trend trading strategy, so accuracy and safety are very high. Today, I will present all of you about the Channel pattern and how to trade with it in the most complete and detailed way.
Register an Olymp Trade account NowGet $10,000 Free for beginners
Key Takeaways
- Definition: A channel pattern consists of two parallel trendlines (support and resistance) that enclose price movement, highlighting clear trend corridors.
- Three Main Types: Ascending (sloping up), Descending (sloping down), and Horizontal (sideways rectangle).
- Trend-Following Principle: In sharp channels, avoid counter-trend trades. Buy only at support in ascending channels, and sell only at resistance in descending channels.
- Risk Management: Always apply the 2% account risk rule, target a minimum 1:2 Risk-to-Reward (R:R) ratio, and verify entries with price rejection signals and volume.
- Breakout Mechanics: True breakouts occur on strong volume with a candle close outside the channel boundaries, often verified by a subsequent retest.
- Measured Move Target: The profit target is determined by measuring the vertical width of the channel and projecting that distance from the breakout point.
What is a Channel Pattern?
The Channel pattern is a development of price following the trend which consists of two parallel support and resistance levels. Prices will fluctuate and create trends along the corridor created by these 2 levels.
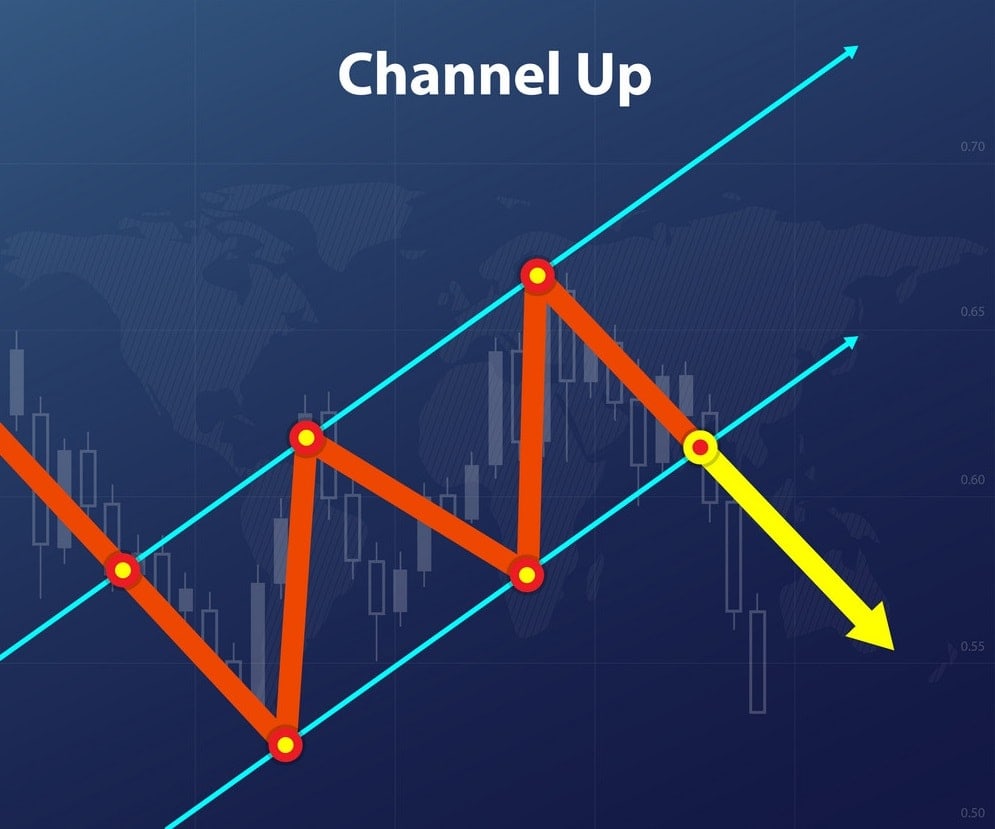
This pattern ends when the price breaks out of either the resistance or support and creates a new trend. The breakout direction is often in the opposite direction to the direction of the pattern. From a market structure perspective, a channel captures a period of balanced progression. The buyers and sellers are in temporary agreement on the rate at which the asset should appreciate or depreciate. The upper resistance boundary represents selling pressure (supply) capping price growth, while the lower support boundary represents buying interest (demand) defending the floor. When price approaches these limits, traders look for trading opportunities based on price exhaustion or potential breakout force.
Three Common Types of Channel Patterns
With 2 parallel and horizontal resistance and support levels, this is a rectangular price pattern that is also known as a horizontal channel. In technical analysis, we categorize price channels based on their slope. We will focus on the three primary types: Channel Up, Channel Down, and Horizontal Channels. Let’s break down their structures and implications.
Channel Up (Ascending Channel)
This Channel pattern type has 2 parallel and upward levels of Resistance and Support. The breakout of this pattern will usually be at the support. After the breakout, the price will reverse down. In some cases, the price may retest this support. If you don’t know what retest is, please review this article: What is Retest? Why is it so magical?
To draw an ascending channel, connect at least two swing lows to form the support line, and then draw a parallel line connecting the swing highs to establish the resistance line. This pattern illustrates a steady bullish trend. However, structurally it represents an overextended market, which is why a downside break through the support line is the most common resolution, indicating a shift in momentum from bullish to bearish.
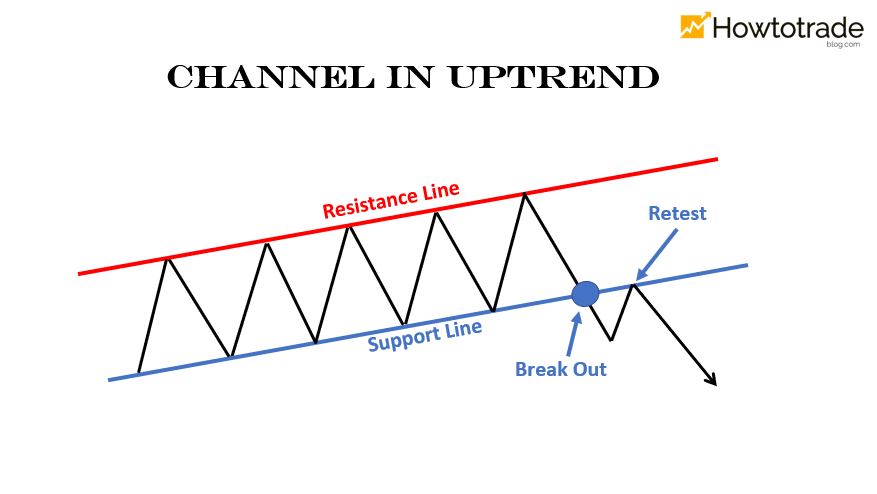
A practical example of a Channel Up pattern in the real market is shown below. You can see how the price bounces multiple times within the parallel bounds before the breakout occurs.

Channel Down (Descending Channel)
In contrast to the Channel Up pattern, we have the Channel Down pattern with 2 parallel and downward levels of resistance and support. After creating this pattern, the price usually breaks out upwards (resistance breakout) and goes up. It is possible for a strong uptrend to appear after this breakout.
To draw a descending channel, connect at least two swing highs to establish the downward-sloping resistance line, and project a parallel line connecting the swing lows to establish the support line. This pattern illustrates a steady bearish trend. Although the price moves downward, it represents a bullish consolidation block on larger timeframes. Once the price breaks and closes above the resistance line, it signals that the sellers are exhausted, often leading to a strong upward reversal.
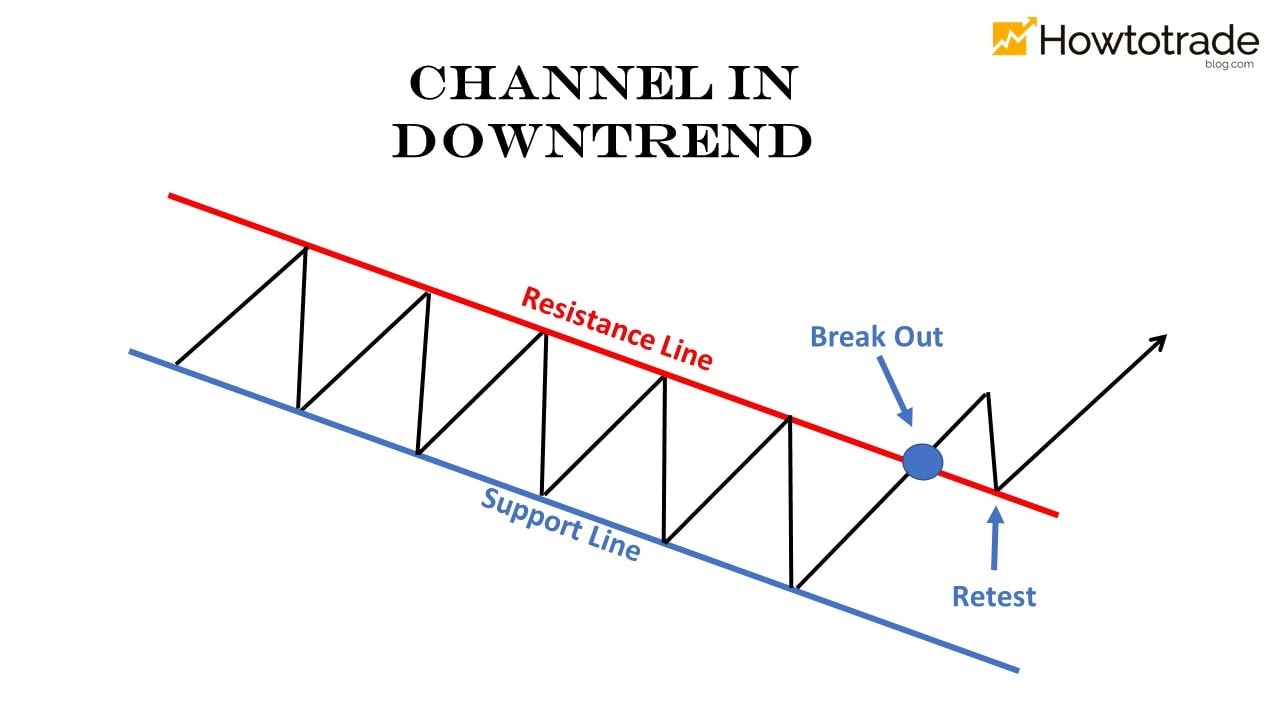
A practical example of a Channel Down pattern. Note how the price touches the boundaries cleanly, respecting the parallel corridor until the eventual breakout occurs.

Horizontal Channel (Rectangle / Trading Range)
A horizontal channel forms when the price moves sideways within a flat corridor. The support and resistance boundaries are horizontal lines (zero slope). This indicates a balanced market phase where buyers and sellers are equal in power. Buying at the support line and selling at the resistance line is the primary range-trading strategy. When a breakout occurs, the price will initiate a new major trend, releasing the consolidated volume.
Comparison Table: Channel Patterns Side-by-Side
To help you understand the structural differences and standard trading logic for each channel style, we have summarized their properties in this comparative table:
| Channel Type | Slope Direction | Market Bias | Common Breakout Direction | Inside Swing Strategy | Target Move Projection |
|---|---|---|---|---|---|
| Ascending (Channel Up) | Upward (Positive Slope) | Bullish Trend | Downside (Below Support) | Buy at Support only (Ignore counter-trend shorts) | Channel width projected downward from breakout |
| Descending (Channel Down) | Downward (Negative Slope) | Bearish Trend | Upside (Above Resistance) | Sell at Resistance only (Ignore counter-trend longs) | Channel width projected upward from breakout |
| Horizontal (Rectangle) | Flat (Zero Slope) | Neutral / Consolidating | Bi-directional | Buy at Support & Sell at Resistance (Dual-side trading) | Range height projected in breakout direction |
Characteristics of this pattern
+ The Channel pattern needs at least 2 peaks to form a resistance and 2 troughs to form a support.
+ When trading, you should only open UP order in a Channel Up and DOWN orders in a Channel Down.
+ Parallel Lines: If the support and resistance lines are not parallel, you are dealing with a different chart structure such as a wedge or triangle. Strict parallelism is essential to define a true channel corridor.
+ The Midline: Many channels contain a dotted midline. This midline represents the fair value level during the consolidation and often acts as a minor support and resistance line where minor reversals can occur.
How to Trade Effectively with the Channel Pattern
Here, I will guide you to use this Channel pattern in both Forex and binary options trading. All will be presented in great detail so that you can optimize your profits as well as minimize your risk when opening orders with this pattern.
Trade Forex Effectively with the Channel Pattern
In Forex, there are 2 types of trading using the Channel pattern: trading within the price channel and trading as per the breakout of the pattern.
CRITICAL WARNING: The Danger of Counter-Trend Trading in Steep Channels
One of the most common errors made by retail traders is attempting to play both sides of a sloping channel. For instance, in an ascending channel, they might open a long position at support and then try to open a short position at resistance. This counter-trend strategy is highly risky. In an ascending channel, the dominant momentum is bullish. Opening a short position means trading against the trend. If the trend is steep, the price may not pullback to support, but instead break above resistance, causing significant losses.
The Safety Principle: In a Channel Up, only open UP (BUY) orders. Conversely, in a Channel Down, you can only open DOWN (SELL) orders. In horizontal channels, trading both sides is acceptable because the market does not have a clear slope. Aligning your entries with the channel slope drastically increases your win rate.
Capital Management: The 2% Rule and 1:2 Risk-to-Reward Ratio
No pattern is 100% accurate. To protect your capital, always apply the 2% rule: never risk more than 2% of your account balance on any single transaction. Additionally, ensure that your setups have a minimum Risk-to-Reward (R:R) ratio of 1:2. This means that if your stop-loss is set at 20 pips, your take-profit must be at least 40 pips. If the channel is too narrow to allow a 1:2 ratio, do not open a trade.
Verify Entries with Volume and Price Action
Do not place an entry order immediately when the price touches a boundary. Wait for validation. Look for rejection candlesticks, such as a Pin Bar or Bullish/Bearish Engulfing candle. Furthermore, check volume: volume should decrease as the price approaches support or resistance, showing momentum exhaustion, and then spike when the price rejects the boundary, confirming that big players are stepping in.
How to open a swing trade order is as follows:
For a Channel Up:
+ Entry Point: When the price hits the support of the price channel. Wait for a bullish rejection candle (e.g., Hammer or Engulfing) on high volume to confirm the bounce.
+ Stop-Loss: At the previous position where the price touched the support (slightly below the low of the rejection candle).
+ Take-Profit: When the price hits the resistance (or slightly below it to ensure execution).
Please see the image below to better understand how to open orders with the Channel Up.

If the previous order wins, the stop-loss of the following order will be the entry point of the previous order, or you can trail your stop-loss behind the rising support line.
For a Channel Down:
When the price is in a Channel Down, you open an order as follows:
+ Entry Point: When the price hits the resistance. Wait for a bearish rejection candle (e.g., Shooting Star) on high volume to confirm the hold.
+ Stop-Loss: At the previous position where the price touched the resistance (slightly above the high of the rejection candle).
+ Take-Profit: When the price hits the support (or slightly above it to secure profits).

If the previous order wins, the stop-loss of the following order will be the entry point of the previous order, or you can trail your stop-loss behind the falling resistance line.
Trade as Per the Breakout
The trading strategy is based on the breakout point of the price channel. This is a very good signal of a trend reversal. When trading breakouts, wait for a candle to close completely outside the channel boundary on strong volume to confirm it is a true breakout. If the breakout occurs with low volume, it is likely a false breakout (fakeout) designed to trap traders. Waiting for a retest of the broken level is a highly effective way to manage risk.
For a Channel Up (Bearish Breakout):
+ Entry Point: When the candlestick breaks out of the support. Enter short either immediately on the confirmation close or wait for a pullback and retest of the broken support as new resistance.
+ Stop-Loss: At the previous position where the price touched the resistance (or above the swing high of the breakout structure).
+ Take-Profit: When price re-touches the support levels it created within the pattern. You can also project the take-profit target using the measured move technique by projecting the channel width downward from the breakout point.

For a Channel Down (Bullish Breakout):
+ Entry Point: When the candlestick breaks out of the resistance. Enter long on the confirmation close or wait for a pullback and retest of the broken resistance as new support.
+ Stop-Loss: At the previous position where the price touched the support (or below the swing low of the breakout structure).
+ Take-Profit: When price re-touches the resistance levels it created within the pattern. You can also project the take-profit target using the measured move technique by projecting the channel width upward from the breakout point.
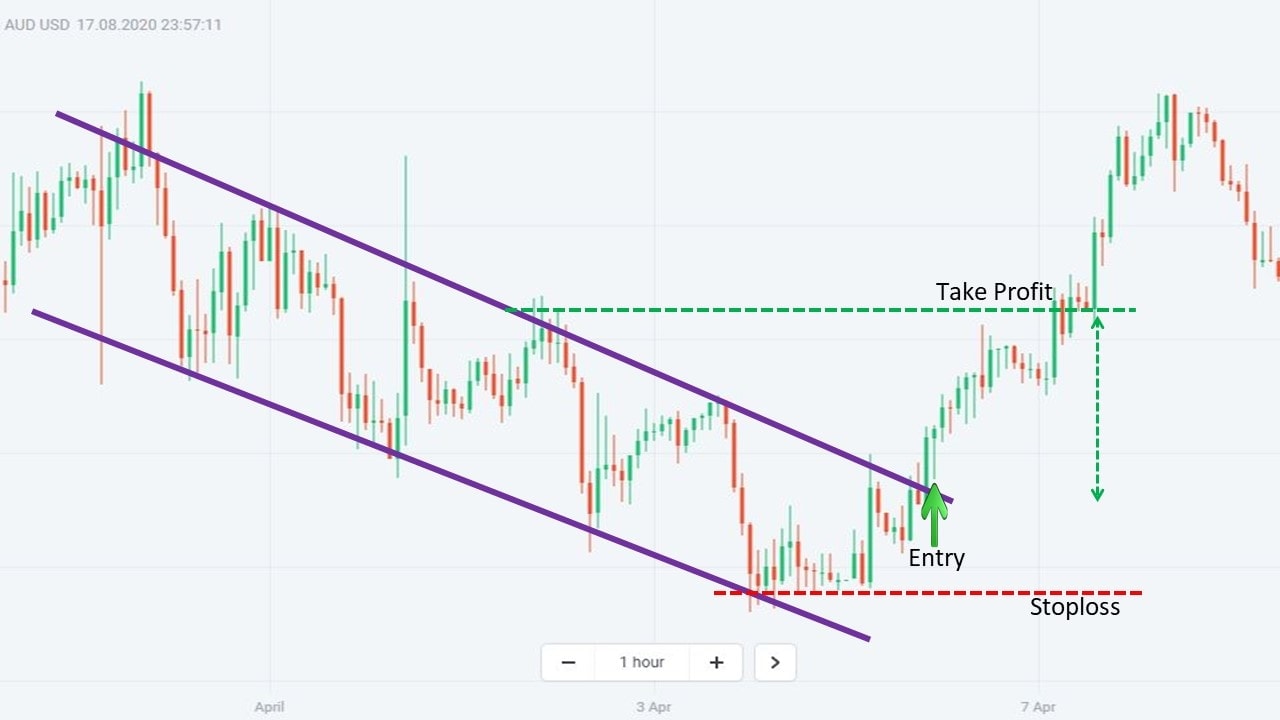
Measured Target Calculation: The Proportional Rule
The measured target calculation is a mathematically proven method to define take-profit boundaries after a breakout. The height of a channel represents the distance between its parallel support and resistance lines. Since this height reflects the consolidation volume, a breakout usually extends that same height outside the channel boundaries.
How to Calculate:
- Measure the vertical height of your price channel (Resistance Price minus Support Price at a given vertical cross-section).
- For a bullish breakout, add this height value to the breakout point price. This is your target take-profit level.
- For a bearish breakout, subtract the height value from the breakout point price. This is your target take-profit level.
By placing your take-profit orders at these calculated levels, you capture the logical move extension while avoiding the risks of holding a position after the momentum exhausts.
Trade Binary Options Effectively with the Channel Pattern
In binary options trading, opening reversal orders when the price is within the price channel is the safest and most effective strategy. Please note that you should open orders with a long expiration time to avoid fake price signals. Short-term noise on small timeframes can easily trigger losses if you choose a short duration.
Requirements: Open an order with a long expiration time (if you are using a 5-minute candlestick chart, the expiration time will be 45-60 minutes, which represents 9 to 12 candles. This ensures that the price has enough time to reverse and move away from the entry point).
You open an order in binary options trading as follows:
+ Open an UP order when the price touches the support of the pattern and shows clear bullish rejection.
+ Open a DOWN order when the price touches the resistance of the pattern and shows clear bearish rejection.
Risk Warning: Binary options involve a high risk of capital loss due to their all-or-nothing structure. Never risk more than 1% of your total account capital on a single option, and avoid trading during highly volatile news releases.

The Last Word
The article is a bit long. However, I have covered everything I know when trading with price channels. Thank you for reading. Do you have any tips for trading with price channels? Please help me improve.
In the article, I used images taken from the Olymp Trade trading platform. This is a trading platform with 2 trading types including Forex and binary options (FIXED TIME TRADES). It is very convenient for you to experience the Channel pattern. If you do not have an Olymp Trade account, please register one by clicking on the box below. Goodbye and wish you successful transactions.
Register an Olymp Trade account NowGet $10,000 Free for beginners
Frequently Asked Questions (FAQ)
What is the main difference between an ascending channel and a rising wedge?
The primary difference lies in the slope lines. An ascending channel features strictly parallel support and resistance lines, showing consistent, stable upward progress. A rising wedge features converging lines, where the support line rises faster than the resistance line. This convergence indicates that buyers are losing momentum, making the rising wedge a more aggressive bearish reversal pattern than an ascending channel.
Why should I avoid counter-trend trading inside a steep channel?
Counter-trend trading involves taking trades against the dominant direction of the channel (e.g., shorting at resistance in an ascending channel). In steep channels, the trend momentum is very strong. Trying to trade against it is highly risky, as the price may consolidate briefly at the boundary and then surge right through your stop-loss, leading to frequent losses.
How many touchpoints are required to validate a channel pattern?
To draw and validate a price channel, you need at least two contact points on the upper resistance line and two contact points on the lower support line (a minimum of 4 points total). Channels with three or more touchpoints on each line are considered significantly stronger and more reliable.
What is a false channel breakout, and how can I avoid it?
A false breakout (or fakeout) occurs when the price temporarily breaks out of a channel line but quickly reverses and returns inside the channel boundaries. To avoid getting trapped, always wait for a candle to close completely outside the channel boundary on your trading timeframe. Additionally, check for a volume spike on the breakout candle, or wait for a pullback and retest of the broken level before entering.
Can I use the channel pattern for day trading?
Yes, the channel pattern is fractal, meaning it forms on all timeframes, from 1-minute charts for scalping to daily and weekly charts for swing trading. Day traders frequently use channels on 5-minute, 15-minute, and 1-hour charts to trade intraday bounces and breakout extensions.


Yeah i proper rate channel patterns tho but what about those dodgy fakeouts 😭💥💯🤔🙌
Okay so like, Im literally just starting out in trading and this channel pattern thing sounds kinda confusing.
* Is it basically just drawing lines on a chart? 😭
* How do you even know if you’re drawing the right lines lowkey?