Key Takeaways: Mastering the Rectangle Pattern
- Structural Phase: The rectangle pattern represents a horizontal consolidation channel where supply and demand reach a temporary equilibrium before a breakout.
- Versatility: Depending on the breakout direction, the pattern can act as a trend continuation signal or a major trend reversal signal.
- Trade Setup Criteria: Valid patterns require a minimum of two touches on both support and resistance. Watch for “shortfalls” as early breakout indicators.
- Strict Risk Management: Avoid high-risk grid averaging or Martingale systems. Trade breakouts using a maximum 2% risk rule and at least a 1:2 Risk-to-Reward (R:R) ratio.
- False Breakouts: Reduce the risk of fakeouts by entering only on closed candles outside the boundaries or waiting for a confirmed retest of the broken level.
There are many types of pause in each trend. One of them is the Rectangle pattern. This is the type of pattern used by many traders as an effective trading strategy for themselves. Today’s article will introduce you to this special chart pattern.
Register an Olymp Trade account NowGet $10,000 Free for beginners
What is a Rectangle pattern? Common types and characteristics of this pattern
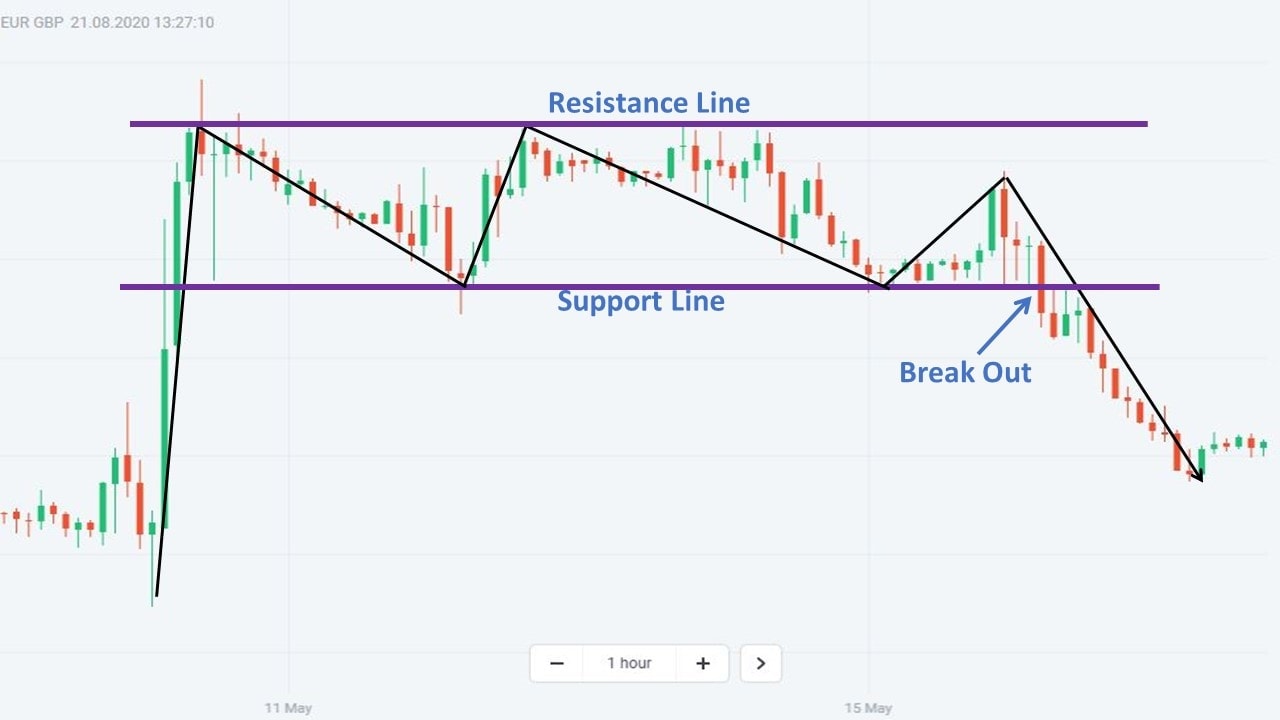
The rectangle pattern is a classic technical analysis chart formation characterized by price bouncing between two parallel, horizontal barriers: a ceiling of resistance and a floor of support. In market structure theory, this horizontal channel represents a phase of market consolidation. It is a period of temporary equilibrium where the force of buyers (demand) and the force of sellers (supply) are balanced, resulting in a sideways trading range.
Consolidations typically occur after a sustained uptrend or downtrend. Think of the market as an athlete who needs to rest and catch their breath after running a long distance. During this consolidation “rest” period, institutional traders accumulate or distribute positions without dramatically moving the price. Depending on the ultimate direction of the price breakout, the rectangle pattern can signal either a continuation of the prior trend or a major trend reversal.

Core Characteristics of the Rectangle Pattern
To properly identify a high-probability rectangle pattern and distinguish it from random market noise, you must look for the following defining characteristics:
- The Resistance Level (Supply Ceiling): This is the horizontal line connecting the reaction highs. When the price reaches this level, sellers overwhelm buyers, creating a supply zone that rejects the price downward.
- The Support Level (Demand Floor): This is the horizontal line connecting the reaction lows. When the price falls to this level, buyers step in aggressively, creating a demand zone that drives the price back upward.
- Minimum Touchpoint Requirement: A valid rectangle pattern must have at least two distinct tests of resistance and two distinct tests of support (four touchpoints in total). If the price bounces only once off support and resistance, a trading channel is not yet established.
- The Shortfall: A highly predictive phenomenon within the range is the “shortfall”. A shortfall occurs when the price bounces off one level but fails to reach the opposite boundary, turning back mid-range. For example, if the price bounces off support but turns downward before reaching the resistance ceiling, it indicates that buyers are exhausted and selling pressure is mounting early. This is a strong indicator that the eventual breakout will be downward. Conversely, if the price bounces off resistance but fails to reach the support floor before turning back up, it signals that buyers are stepping in early, and an upward breakout is highly likely.
- Volume Trends: Trading volume typically diminishes as the rectangle pattern develops. This reflects the cooling of market interest during the consolidation. When the breakout occurs, a sudden and massive spike in volume confirms that institutional capital has entered to drive the new trend.
Common types of patterns
Based on where the pattern forms within the market cycle, the rectangle pattern is divided into two primary categories: the Top Rectangle and the Bottom Rectangle.
Top Rectangle
The Top Rectangle forms after the price has completed a sustained uptrend. As the price reaches a high level, buying momentum slows down, and sellers begin to enter, leading to a horizontal consolidation channel. This pattern represents a battleground where the market decides whether the asset is ready to push higher (accumulation) or has reached a peak and is about to reverse (distribution).

Depending on the breakout direction, the Top Rectangle can lead to two distinct market scenarios:
Top Rectangle pattern – Upward breakout: Bullish trend continuation signal.
In this scenario, the buyers maintain their control. They successfully absorb all the supply offered by sellers at the resistance level. When a strong bullish candlestick breaks out and closes above the resistance ceiling, it confirms that the previous uptrend has resumed. The rectangle, in this case, acts as a bullish re-accumulation pattern.

Top Rectangle pattern – Downward breakout: Trend reversal signal.
On the contrary, if the buying pressure is exhausted and institutional players decide to distribute (sell) their holdings, the support line will eventually fail. When a bearish candlestick closes below the support floor, it signals that the bulls have lost control, and a major trend reversal from bullish to bearish is underway.
Bottom Rectangle
The Bottom Rectangle occurs at the end of a prolonged downtrend. As the asset reaches lower price levels, sellers begin to cover their short positions to lock in profits, while value buyers begin to buy the asset. This creates a horizontal range. The Bottom Rectangle is a critical structural pattern because it marks the transition phase from a bearish market environment to either a continuation of the downtrend (re-distribution) or a major bullish recovery (accumulation).

Bottom Rectangle – Downward breakout: Trend continuation signal.
In this case, the consolidation is simply a temporary breathing room for sellers. The bulls fail to establish any lasting demand, and once the consolidation range is exhausted, the price breaks out below the support line. This confirms that the bearish trend has resumed and will continue to decline.

Bottom Rectangle – Upward breakout: Trend reversal signal.
If buyers step in heavily and completely absorb all the selling pressure at support, the resistance level will eventually break. When a bullish candlestick closes above the resistance level, it signals a major trend reversal. The market character switches from a downtrend to a brand-new uptrend.

Trading Strategies: Rectangle Breakout vs. Range-Bound Swing Strategy
To trade the rectangle pattern effectively, you must understand the two primary methodologies available: trading the breakout and trading the range boundaries. Each strategy requires a different execution technique, trade setup, and risk parameter. Below is a detailed comparison to help you choose the best approach based on your trading style and prevailing market conditions.
The Danger of Risky Strategy Replacements & Advanced Risk Management
Consolidation channels like the rectangle pattern can be highly deceptive for retail traders. Because the price appears to respect horizontal levels, many amateur traders fall into the trap of using high-risk betting strategies.
Why Grid Averaging and Martingale Systems are Account Killers
A common trap is using the Martingale system (doubling your position size every time you take a loss) or grid averaging (continually adding buy orders as the price drops towards support, or sell orders as it rises towards resistance) inside the rectangle range. The theory behind these systems is that since the price is range-bound, it must eventually bounce back, allowing you to exit all trades at a profit.
However, this logic works only until the price breaks out. When a rectangle pattern experiences a genuine breakout, the price moves violently and with massive institutional momentum. If you are using Martingale or grid averaging, you will find yourself holding multiple, large, losing positions against a powerful new trend. In a matter of minutes, this can compound your losses and lead to a complete blowout of your trading account. Never average down on a losing trade, and never hold positions without a hard stop-loss.
Professional Risk Management Guidelines
To trade the rectangle pattern successfully over the long term, you must operate like a risk manager. Adhere strictly to these professional rules:
- The 2% Rule: Never risk more than 2% of your total trading account equity on a single trade. For example, if you have a $5,000 account, your maximum risk (loss) on any single setup must be capped at $100. This ensures that even a string of five losses will only draw down your account by 10%, keeping you in the game.
- Minimum 1:2 Risk-to-Reward (R:R) Ratio: Every trade you take must offer a potential profit that is at least twice the size of your risk. If your stop-loss is placed 25 pips away, your target take-profit must be at least 50 pips. A positive R:R ensures that you can win only 40% of your trades and still remain highly profitable overall.
- Volume-Verified Entries: Do not enter trades inside the range unless you see clear price action signals. More importantly, when trading breakouts, always check the volume indicator. A valid breakout is backed by high volume. If the volume is low, treat the breakout as a high-risk fakeout.
How to trade effectively with a Rectangle pattern
The Rectangle pattern is widely used in Forex trading by experienced traders. In this article, I will guide you to use this special chart pattern to open Forex and Binary Options orders for maximum efficiency.
For Forex
When using this pattern to open Forex orders, you need to verify your entry point, stop-loss, and take-profit targets. This will ensure account safety and optimal profitability.
You can open an order when encountering a Rectangle pattern as follows:
Regarding the Rectangular pattern with an upward breakout:
- Entry Point: Enter a buy (long) position right after the candlestick breaks out and closes above the resistance level of the rectangle. For a safer entry, you can wait for the price to pull back and retest the broken resistance (which now flips to support) and enter on a bullish rejection candle.
- Stop-Loss: Place your stop-loss just below the support level of the rectangle pattern. Alternatively, place it below the mid-line of the range to maintain a tighter risk profile.
- Take-Profit: Calculate the vertical height of the rectangle (the distance between resistance and support). Project this exact distance upward from the breakout point to find your profit target. This is a mathematically verified target because a breakout from a rectangle typically replicates the depth of the consolidation range.

Regarding the Rectangular pattern with a downward breakout:
- Entry Point: Enter a sell (short) position immediately after the candlestick breaks out and closes below the support level of the rectangle. Alternatively, wait for the price to retest the broken support (which flips to resistance) and enter on a bearish rejection candle.
- Stop-Loss: Place your stop-loss just above the resistance level of the pattern, or above the mid-line of the range.
- Take-Profit: Project the vertical height of the rectangle downward from the breakout point to establish your profit target.

For Binary Options
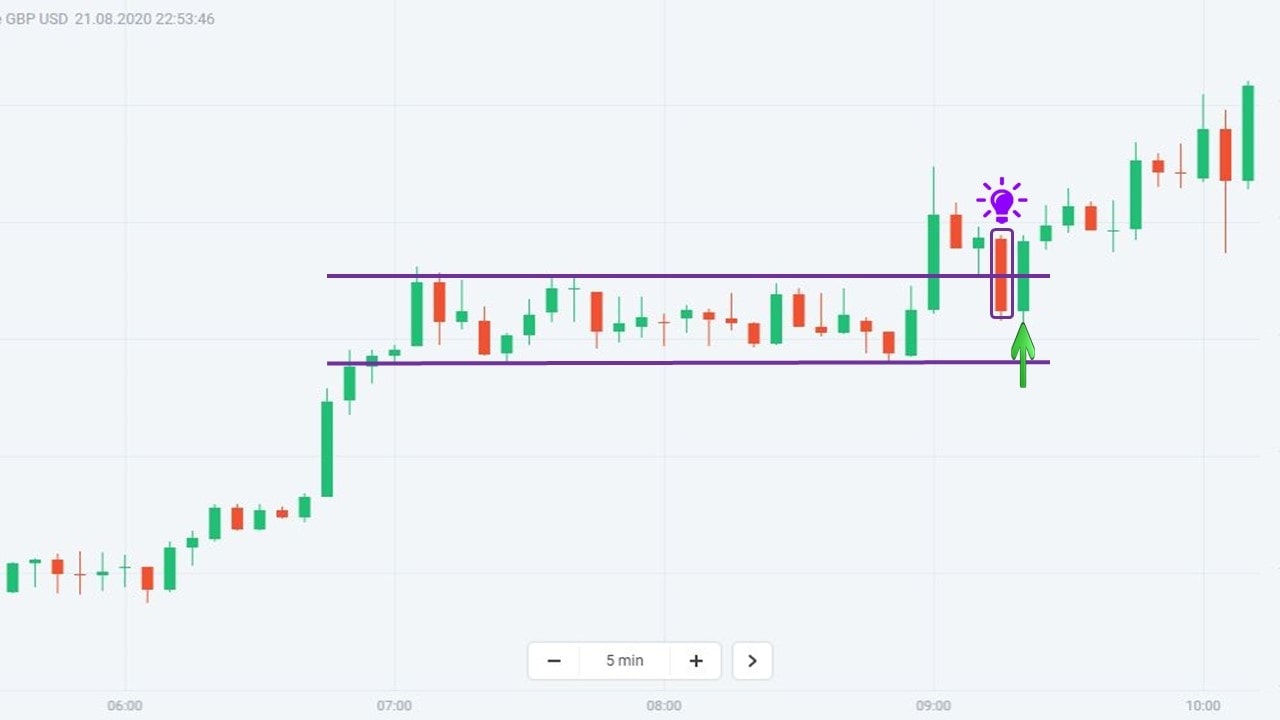
In Binary Options or Fixed Time Trades, you need to be precise in your timing to make a profit. Unlike Forex, where a trade can remain open indefinitely, Binary Options trades have a fixed expiration time. Therefore, trading the retest of the broken level is the safest and most reliable entry method. This allows you to avoid getting trapped by sudden pullback noise.
Requirements: Always open orders with a long expiration time to allow the price action to play out. If you use the 5-minute Japanese candlestick chart for analysis, your order should have an expiration time of 45 to 60 minutes (9 to 12 candles). Short expiration times (e.g., 1 to 5 minutes) are highly susceptible to random market noise that can result in a loss.
You can open an order as follows:
- Open an UP order when the price breaks out of the resistance, pulls back, and retests the resistance level just broken. Enter once the retest is verified by a bullish bounce.
- Open a DOWN order when the price breaks out below the support, pulls back, and retests the support level just broken. Enter once the retest is verified by a bearish rejection.

Understanding and Avoiding False Breakouts (Fakeouts)
False breakouts (often called “fakeouts” or “bull/bear traps”) are the single greatest challenge when trading the rectangle pattern. A fakeout occurs when the price temporarily moves beyond the resistance or support boundary, triggering breakout orders, only to reverse suddenly and slide back inside the consolidation channel.
The Mechanics of a Fakeout
Fakeouts are often engineered by large institutional players (banks, market makers, hedge funds) who require high liquidity to fill their massive orders. Retail traders tend to place their buy-stop orders just above the resistance level, and sell-stop orders just below the support level. To fill their sell positions at high prices, institutions will briefly push the price above the resistance level, triggering the retail buy-stops. Once the liquidity is grabbed and the orders are filled, the price falls rapidly back into the range, trapping the retail breakout buyers in losing positions.
Three Practical Filters to Avoid False Breakouts
To protect your capital from getting trapped in fakeouts, implement these three filters into your trading plan:
- The Candlestick Close Rule: Never enter a breakout trade based on a live, active candle. A candle can spike significantly above resistance during the session, only to close back within the channel. Always wait for the candlestick to close completely outside the support or resistance boundary. The close is the only price that confirms whether the boundary was truly broken.
- The Volume Confirmation Filter: A genuine breakout requires institutional participation. This is represented by a significant surge in trading volume. If a candlestick closes outside the range but the volume indicator shows low or average activity, it is a highly suspicious move and likely a fakeout. A high-probability breakout must show volume that is visibly higher than the average volume of the preceding candles in the range.
- The Retest Entry Method: This is the most conservative and reliable breakout method. Instead of buying the initial breakout, wait for the price to break out, establish a high, and then pull back to test the broken level. If the level holds (e.g., broken resistance flips to support and shows bullish rejection candles like a hammer or pin bar), enter the trade. While you may occasionally miss a rapid, runaway breakout, this method will protect you from the vast majority of fakeouts.
One last word
The trading strategy using a Rectangle pattern is safe and very effective. You can test this pattern on an Olymp Trade Demo account. This is a platform that offers both types of Forex and Binary Options (Fixed Time Trades) trading. Open an Olymp Trade account by clicking on the box below. I wish you successful transactions.
Register an Olymp Trade account NowGet $10,000 Free for beginners
Frequently Asked Questions (FAQ)
Is the rectangle pattern a continuation or a reversal pattern?
The rectangle pattern is highly versatile and can act as both. Its classification depends on the direction of the final breakout. If the breakout occurs in the direction of the prior trend, it is a continuation pattern (e.g., an upward breakout from a Top Rectangle in an uptrend). If the breakout occurs in the opposite direction, it is a reversal pattern (e.g., a downward breakout from a Top Rectangle in an uptrend).
How many touchpoints are required to validate a rectangle pattern?
To confirm a valid rectangle pattern, you must identify at least four distinct touchpoints: two reaction highs that form the parallel resistance ceiling and two reaction lows that form the parallel support floor. A single bounce from each level is not sufficient to establish a reliable range.
What is a “shortfall” in a rectangle range and why is it important?
A shortfall occurs when the price bounces off one of the boundaries but fails to reach the opposite boundary, reversing mid-range. A shortfall indicates that the opposing pressure is building up early, hinting at the likely breakout direction. For example, a bearish shortfall (price failing to reach the resistance line) indicates that sellers are stepping in early, signaling an impending downward breakout.
How do you measure the target price for a rectangle breakout trade?
The profit target for a rectangle breakout is based on the vertical height of the pattern itself. Measure the distance in pips or points between the support and resistance lines. Then, project that exact distance from the breakout point (upward for bullish breakouts, downward for bearish breakouts) to find your target take-profit price.
Why are Martingale and grid averaging strategies dangerous in ranges?
These strategies rely on the price returning to the middle of the range to break even or turn a profit. However, when the price breaks out of the rectangle range, it does so with strong, directional momentum. If you average down on losing trades without a stop-loss, your losses will compound rapidly, resulting in a margin call or complete account liquidation.