


🔑 Key Takeaways
- Trend Alignment is Crucial: Always trade supply and demand zones in the direction of the daily trend. Buy at demand zones in uptrends, and sell at supply zones in downtrends.
- Strict Risk Management: Adhere to the 2% risk rule. Determine your lot size based on your stop loss distance to ensure you never lose more than 2% of your capital per trade.
- Avoid High-Risk Betting Systems: Avoid Martingale, grid averaging, or loss-holding. These dangerous strategies lead to account blowouts; stick to a fixed risk-to-reward (R:R) ratio of at least 1:2.
- Confirm with Price Action: Do not blind-enter trades. Wait for price to retest the zone and react with a confirmation candlestick (e.g., Doji, Pin Bar, or bullish/bearish engulfing) before execution.
- Daily Chart Reliability: The Daily (D1) chart offers clear signals, eliminates market noise, saves analysis time, and yields higher win rates.
This is a whole chapter about real trading. I will talk more about money management and trading psychology. Moreover, I will also share my personal experiences when trading with the strategy: Trend + Supply Demand zones.
Of course, since it is real trading, we will have a more meticulous way of entering orders. Please read chapters 1, 2, 3 that I wrote earlier for better understanding.
Register an Exness account NowGet $1,000 Free for beginners
The Mechanics of Supply & Demand Zones
To trade supply and demand zones successfully, you must first understand what they represent at a structural level. Unlike retail concepts of horizontal support and resistance, supply and demand zones are areas on the chart where institutional market participants—such as major commercial banks, central banks, and sovereign wealth funds—have placed massive block buy or sell orders. Because these institutions handle enormous volumes, they cannot execute their entire positions at once without causing major slippage and driving the price away from their desired entry levels. Instead, they execute a portion of their orders, leaving the rest as unfilled limit orders in the base region. This imbalance between buy and sell orders is what creates the base before the price explodes away (the leg-out).
When the market eventually retraces back to this base (the retest), these unfilled institutional orders are triggered, absorbing the opposing pressure and generating the sharp bounce or rejection we see. Our goal as retail traders is not to predict where the price will go, but to follow these institutional footprints, aligning our trades with the order flow of the smart money.
Anatomy of a Zone: The Base and the Leg-Out
Every valid supply or demand zone consists of two core components: the base and the leg-out. The base is the consolidation or pause in price action where buyers and sellers fight for control. It is represented by one or more small-bodied candles. The leg-out is the subsequent large-bodied candle (or group of candles) that breaks out of the base with strong momentum, signaling that one side has won the battle. The strength of the leg-out is a direct measure of the supply-demand imbalance; the faster and further the price moves away from the base, the stronger the zone is considered to be.
Types of Supply and Demand Structures
Supply and demand zones typically fall into two categories: reversal structures and continuation structures. Understanding these structures allows you to anticipate market behavior when price returns to these key levels.
- Reversal Structures: These occur at major market turning points.
- Rally-Base-Drop (RBD): Price rallies up, pauses to form a base (supply zone), and then drops sharply. This signals a transition from bullish to bearish control.
- Drop-Base-Rally (DBR): Price drops down, pauses to form a base (demand zone), and then rallies sharply. This signals a transition from bearish to bullish control.
- Continuation Structures: These occur within an ongoing trend.
- Rally-Base-Rally (RBR): Price rallies up, pauses to form a base (demand zone), and then continues its rally. This represents a pause in a bullish trend where institutions add to their long positions.
- Drop-Base-Drop (DBD): Price drops down, pauses to form a base (supply zone), and then continues its drop. This represents a pause in a bearish trend where institutions add to their short positions.
How to Draw Supply and Demand Zones Properly
Drawing your zones accurately is essential for setting precise entry triggers and stop losses. A zone is defined by two lines: the proximal line (closer to current price) and the distal line (further from current price).
To draw a Demand Zone (based on a DBR or RBR structure):
- Proximal Line: Placed at the highest body of the base candle(s).
- Distal Line: Placed at the lowest wick of the base candle(s) (including the wicks of the leg-in and leg-out if they are lower).
To draw a Supply Zone (based on a RBD or DBD structure):
- Proximal Line: Placed at the lowest body of the base candle(s).
- Distal Line: Placed at the highest wick of the base candle(s) (including the wicks of the leg-in and leg-out if they are higher).
By placing your stop loss slightly beyond the distal line, you give the trade room to breathe while ensuring a clear invalidation level. If price breaks through the distal line, the zone is invalidated, and you must exit the trade immediately.
The Critical Role of Trend Alignment
One of the most common pitfalls for retail traders is trading every supply and demand zone they identify on a chart. They find a demand zone and buy, even when the market is crashing. They see a supply zone and sell, even if the price is in an explosive uptrend. This counter-trend trading is a low-probability trap. The golden rule of this strategy is simple: Always align your trades with the dominant trend.
In an uptrend, market structure is characterized by higher highs and higher lows. In this environment, you should only look to buy at Demand zones. Supply zones will frequently fail as the upward momentum easily breaks through them. Conversely, in a downtrend, market structure is characterized by lower highs and lower lows. Here, you should only look to sell at Supply zones. Demand zones will frequently fail as sellers dominate the market. To illustrate these differences, look at the table below summarizing the key characteristics of supply and demand zones when trading with the trend:
| Characteristic | Supply Zone (Bearish) | Demand Zone (Bullish) |
|---|---|---|
| Market Imbalance | Supply exceeds Demand (Excess Sellers) | Demand exceeds Supply (Excess Buyers) |
| Price Action Behavior | Price drops rapidly away from the base | Price rallies rapidly away from the base |
| Trend Alignment | Look for sell setups during a Downtrend | Look for buy setups during an Uptrend |
| Trade Execution | SELL (Short) on zone retest & confirmation | BUY (Long) on zone retest & confirmation |
| Stop Loss Placement | Placed slightly above the upper boundary of the zone | Placed slightly below the lower boundary of the zone |
Money management plan
I use an MT4 account to trade in Exness with total money of $30,000. My money management method is Risk/Reward (R:R) with 1R = $600 (2% rule). So each trade I can only lose up to 600$.
Many retail traders fall into the trap of using high-risk systems like Martingale (doubling your position size after a loss in an attempt to recover your losses) or grid averaging (constantly adding new positions to a losing trade as price moves against you). In a trend-following supply and demand strategy, these systems are a direct path to account ruin. A strong, extended trend will easily break through your zones and run indefinitely against your positions. If you keep doubling down or holding onto losing trades without a hard stop loss, you expose your account to unlimited risk. Instead, professional trading relies on capital preservation. You must accept that losses are an inevitable part of trading, keep them small and controlled, and let your edge play out over time.
To calculate trading volume, you can do it with Lot size calculator.
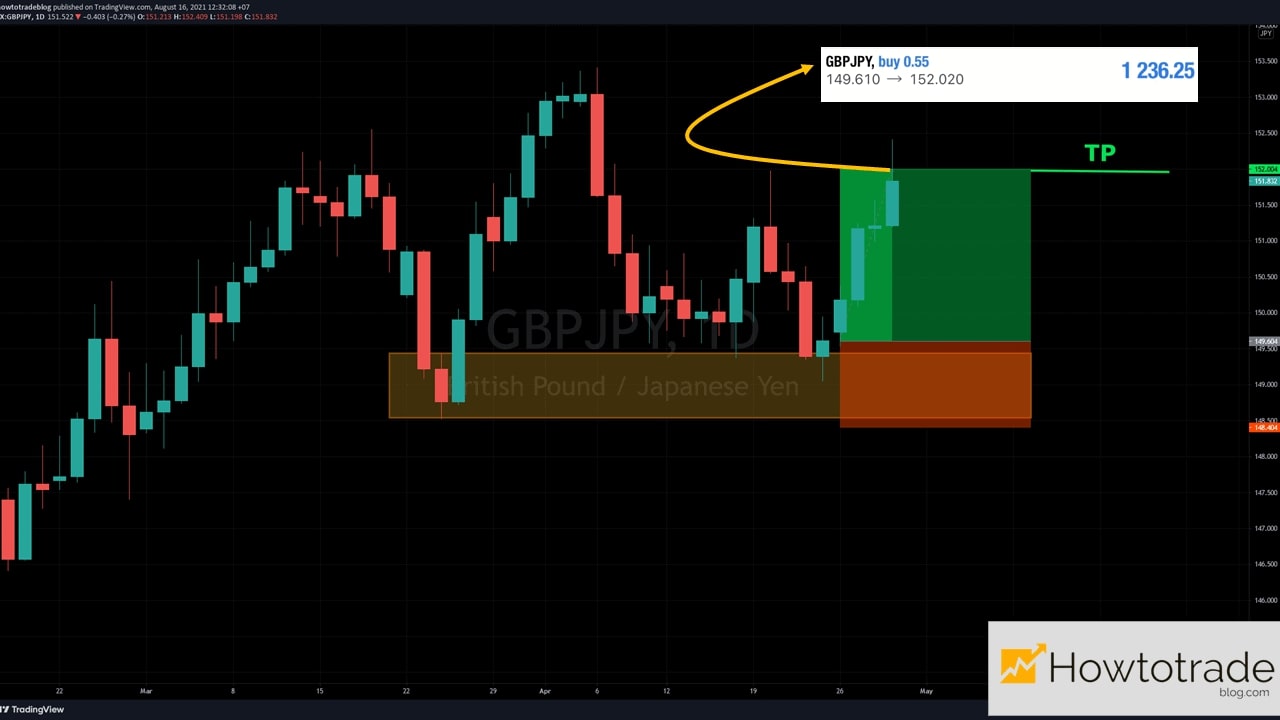
For example, I enter a GBP/JPY order with 120 pips stop loss => My trading volume will be 0.55 lots.

BUY GBP/JPY order
I analyzed the market based on the daily chart. After identifying the Uptrend and the Demand zone, I started waiting for the price to retest and react at this Demand zone with a stop-decreasing candlestick. This was the signal for me to open a BUY order. A stop-decreasing candlestick indicates that the selling momentum has exhausted within the demand zone and buyers are stepping back in. Waiting for this reaction prevents you from catching a falling knife.

As soon as the signal candlestick closed, I entered a BUY trade:
- Stop Loss (SL): 120 pips. SL level will be below the Demand zone.
- Take Profit (TP): 240 pips. So, ratio R:R = 1:2.
- Trading volume: 0.55 lots.

Result: Won 2R profit.
SELL XAU/USD order
In the daily chart, the gold price was in the downtrend and created a Supply zone. The market showed signs that the price was going to rebound and retest this Supply zone. My job was to wait for the reversal signal.

SELL Gold as soon as the price closed with 1 Doji candlestick.
- SL: 250 pips right above the Supply zone
- TP: 400 pips at the old trough.
- Since the stop loss is quite far, I chose a safe trading volume with 0.24 lots (2% rule).

Result: The SELL Gold order won and earned more than 1.5R profit.

SELL USD/JPY order
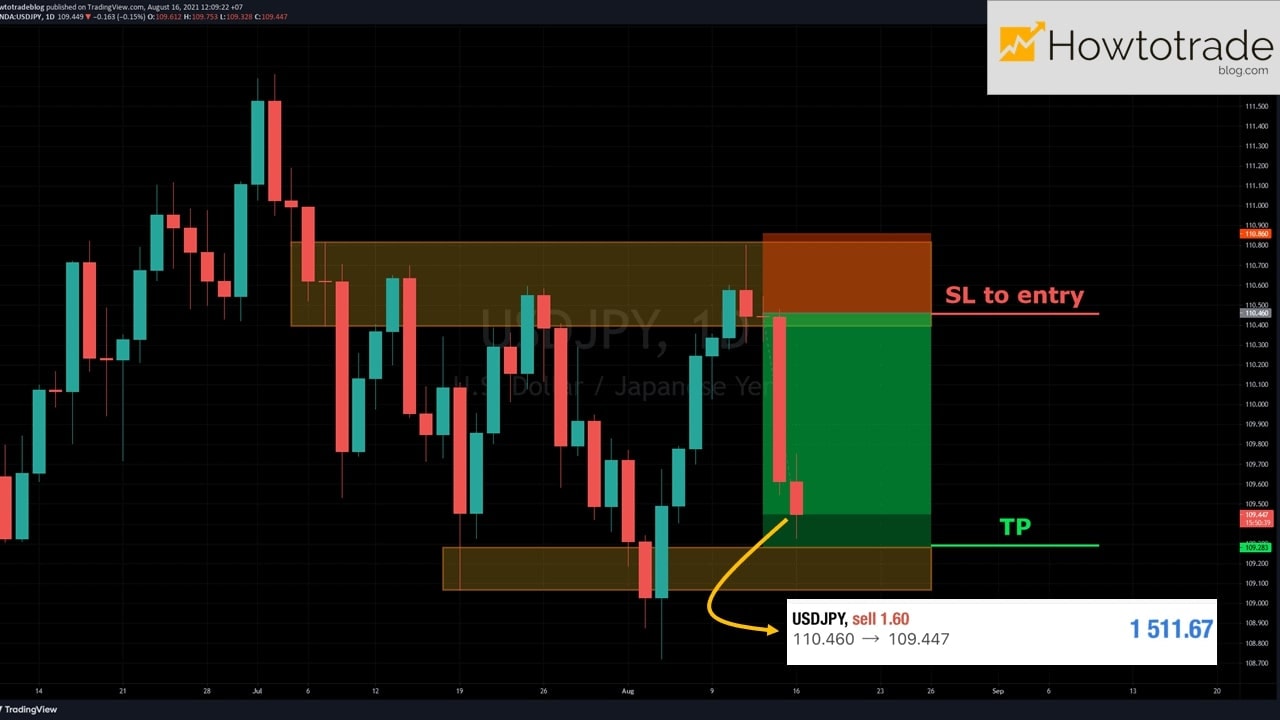
It was still the same scenario with the USD/JPY. The price has been in the process of decreasing and created a supply zone. When it retested at this zone with a Bearish Pin Bar candlestick showing clear upward rejection, I opened 1 SELL order.
- SL: 40 pips. Set above the Supply zone.
- TP: 100 pips. I expected the price to drop to the old trough. R:R = 1:2.5.
- Trading volume: 1.6 lots.

Result: SELL USD/JPY order has not touched TP yet (at the time I wrote this article), but it was winning more than 2.5R profit.
Another SELL XAU/USD order
This is one of the losing trades that I could hardly forget. The gold price was in a downtrend and it entered the Supply zone. After it created a reversal signal with a nice red candlestick, I placed a SELL order.

Result: The order hit SL because the price suddenly flew like a rocket. The market is always like that. Sometimes everything goes smoothly as theory but the result isn’t what you expect.
This trade highlights why risk management is your ultimate shield. If I had not used a hard stop loss, or if I had tried to scale into the losing trade with a grid or double down with a Martingale system as the price surged, my account would have been severely damaged or completely blown. Because I accepted the loss as a standard cost of doing business, my risk was capped at exactly 1R ($600). The loss was completely painless, and my trading psychology remained intact for the next setup.

Real trading experiences
Above are some of the real trading orders that I still keep the history. So, I share the timeline and the reason I place them. Now let’s talk about the advantages and disadvantages of this strategy.
Daily chart analysis
My experience shows that the Supply and Demand zones are more reliable than other chart types when using the daily chart. Signals such as reversal candlesticks, Doji candlesticks on the daily chart give greater safety.
In particular, when using the chart daily for analysis and trading, I don’t get caught up in unexpected price movements of the market. Although the number of trading orders is small, the win rate is quite high.
Trading on the daily time frame filters out the vast majority of market noise and intraday manipulations. You do not have to worry about sudden volatility spikes from lower-tier economic data releases, as the daily candle smooths out these fluctuations. Furthermore, daily zones are respected by large institutions, giving you a statistical edge that lower time frames simply cannot match.
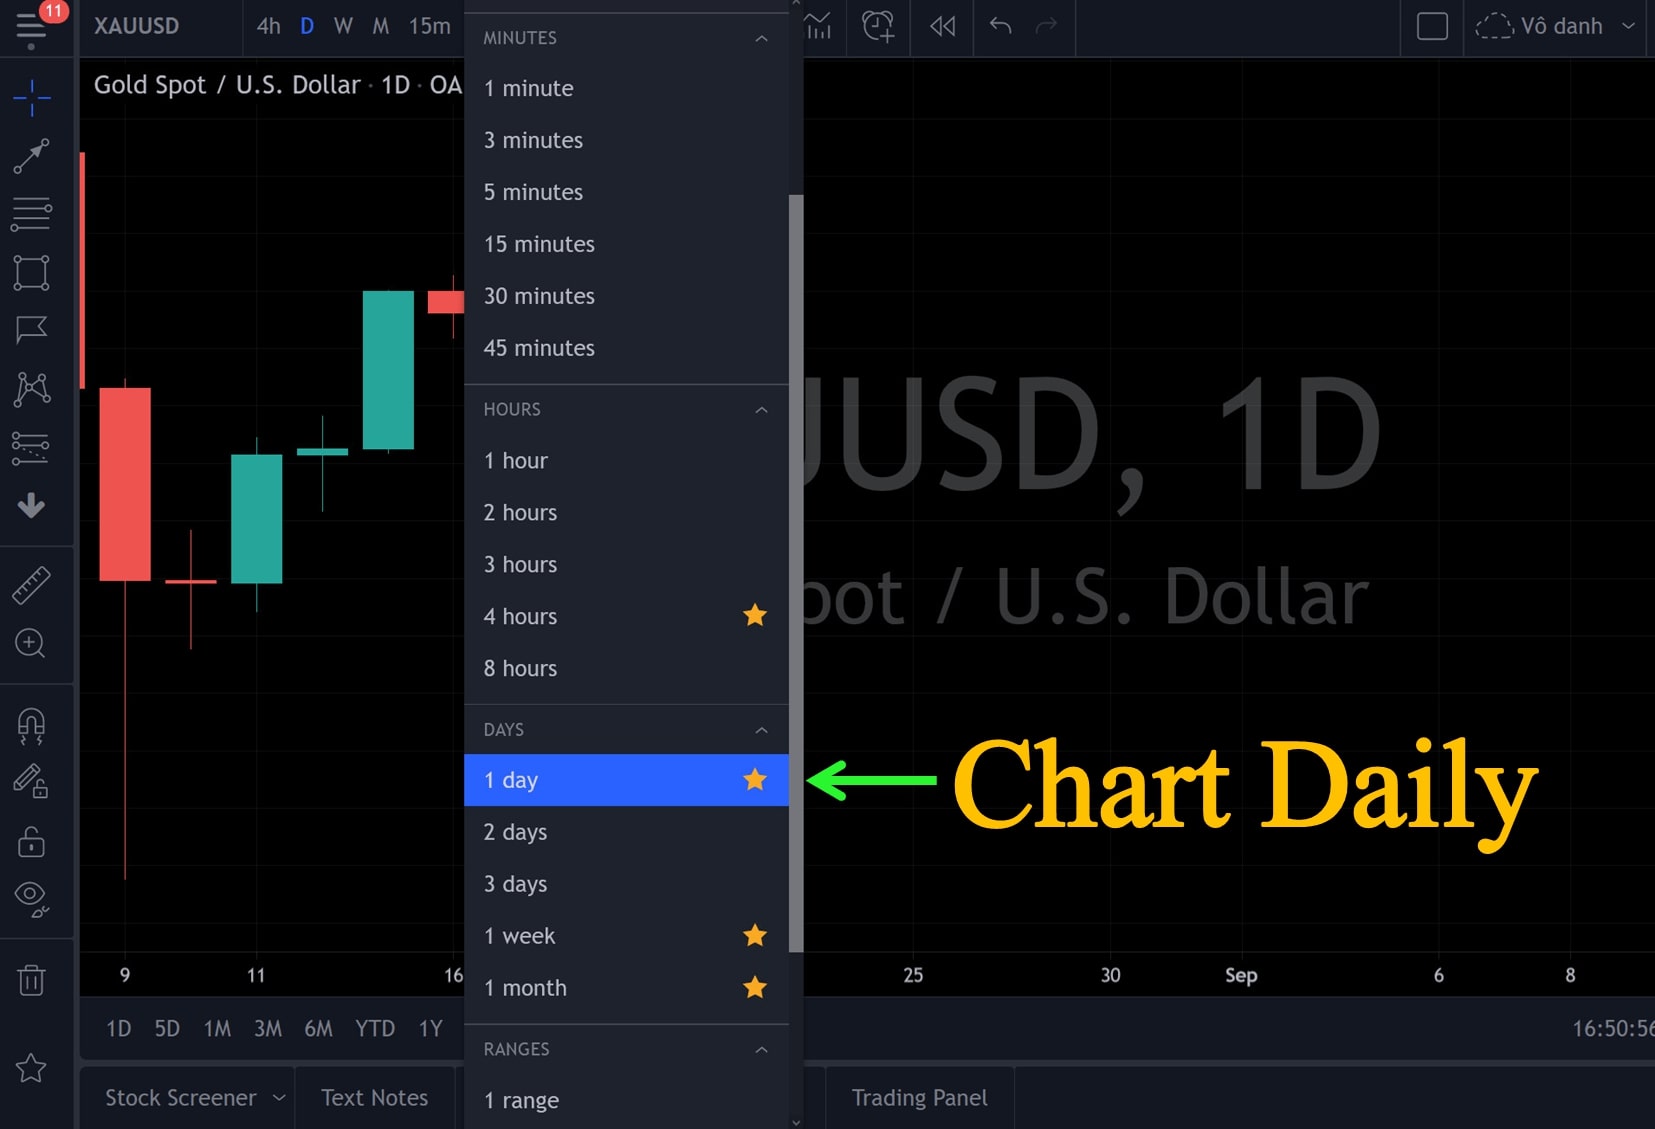
Another advantage of using a daily chart is time saving. It does not take you too much time to analyze. Just identify the trend and Supply Demand zones on Gold or major currency pairs. The rest is waiting for the market to react there. In my free time, I will do other things like writing and translating this article to share with you. This lifestyle freedom is the ultimate goal of trading, and the daily chart is the only time frame that truly provides it.
Money management element
The trading strategy helps you know the entry point, where to set SL and TP, etc. Therefore, you can easily calculate the risk factor for each transaction.
However, in my opinion, money management is more important than the trading method. If you have a good way to control the flow of money, your mind will be calm even when you lose many orders. Almost all people know the strategy but only those who can control their emotions win in the market. That’s why right from the beginning I mentioned money management first. Hope you will understand what I want to convey.
A trader with a robust risk management model can survive long losing streaks and remain profitable in the long run. By keeping your risk strictly at 2% or less per trade, you ensure that no single string of losses can severely impact your account balance. This mathematical safety net keeps your mind clear of panic, enabling you to execute your trading plan with mechanical precision.

Profit taking psychology
Stop Loss for each order is 2% of the account. If you do it well, there is nothing to worry about. But the problem now will be waiting for the price to move to the take profit zone. I call this “the profit taking psychology”.
If a person’s mind is weak and afraid of losing, he or she can close the order soon when the price has only gone half of its way. That’s still okay but it’s not worth the time you spend waiting for that order. When you exit trades prematurely out of fear, you mathematically reduce your risk-to-reward ratio. Over time, a series of early exits converts a profitable 1:2 R:R system into an unprofitable 1:1 or 1:0.5 system. To build a successful trading business, you must build the emotional discipline to leave your trades alone. Once the order is placed with a clear stop loss and profit target, let the market decide the outcome. Either you hit your target or you hit your stop—there is no middle ground.
A long way to go
Sometimes I can only trade 1 order a week but that’s not a problem for me. I come to this market to learn how to survive and make long-term profits. Therefore, my priority is to keep the money safe.
If you follow this strategy, sometimes you will find it quite boring and feel a bit “greedy” when you see many other traders earning more than you. Everyone has their own trading style. If you choose to go slowly, safely and sustainably, this strategy is right for you. Trading is a long-term business of compounding small, consistent gains. If you seek excitement or quick riches, the market will quickly take your capital. Embrace the patience required for daily chart analysis, let go of FOMO, and treat your trading with the discipline it deserves.

Summary
I would like to close the trading series based on Supply and Demand zones in this article. If you’ve read all four chapters, you can test this trading system on any platform like Tradingview, MT4/MT5. But don’t get cocky after winning in the demo account. It is very different when you trade with your real money.
Let’s practice and make it your own trading experience. Thank you and see you again in the next articles.
Register an Exness account NowGet $1,000 Free for beginners
Frequently Asked Questions (FAQ)
What are supply and demand zones?
Supply and demand zones are price areas on a trading chart where significant buying or selling pressure originated, leaving behind unfilled institutional orders. When the market returns to these zones, those orders are filled, often leading to a strong price bounce or reversal.
How do supply and demand zones differ from traditional support and resistance?
Support and resistance are typically drawn as single horizontal lines based on peak price points, whereas supply and demand zones are broader price ranges representing the origin of a major imbalance. Zones are more dynamic and focus on where institutional order block liquidity is clustered.
Why are Martingale and grid systems dangerous for trend trading?
Martingale and grid strategies involve multiplying trade sizes or adding to losing positions in the belief that the market will reverse. In trending markets, a price movement can break through zones and run indefinitely against your trades. These systems lead to massive drawdowns and complete account wipeouts because retail capital is finite.
How do I apply the 2% rule using a lot size calculator?
To apply the 2% rule, determine the distance between your entry price and your stop loss in pips. Input this distance, your total account balance, and your 2% risk limit into a lot size calculator to determine your exact volume. This ensures you never lose more than 2% of your capital on any single trade.
Why is the daily chart the best time frame for supply and demand zones?
The daily (D1) chart is highly reliable because it filters out intraday retail market noise and algorithmic fakeouts. It represents the time frame where major banks and institutional players plan their long-term positions, offering cleaner structures and a higher overall trade success rate.



For quant trading, the article’s D1 chart emphasis, while reducing noise, isn’t always the full picture.
– Algos can extract perfectly viable signals from lower timeframes, actually capturing much faster entries.
– its more about balancing latency against overall opportunity cost, I think.
– That daily-only approach can be kinda limiting.