


Following part 1, today, we will learn about a school of market analysis that is used by most traders. That is “Technical analysis”.
Register an Exness account NowGet $1,000 Free for beginners
🔑 Key Takeaways
- Core Philosophy: Technical analysis studies historical price action and market data to forecast future price movements based on repeating psychological patterns.
- Dow Theory: Built on three premises: price discounts all information, price moves in trends, and history repeats itself.
- Chart Types: Line charts offer high-level simplicity, bar charts add Open-High-Low-Close data, and candlestick charts provide visual insight into buying/selling pressure.
- Support & Resistance: Horizontal and dynamic levels act as ceilings and floors, reversing roles (S/R flips) once broken.
- Risk Management: Strict adherence to stop-losses and the 2% rule is mandatory. Avoid catastrophic Martingale or grid averaging schemes.
What is Technical Analysis in Forex Trading?
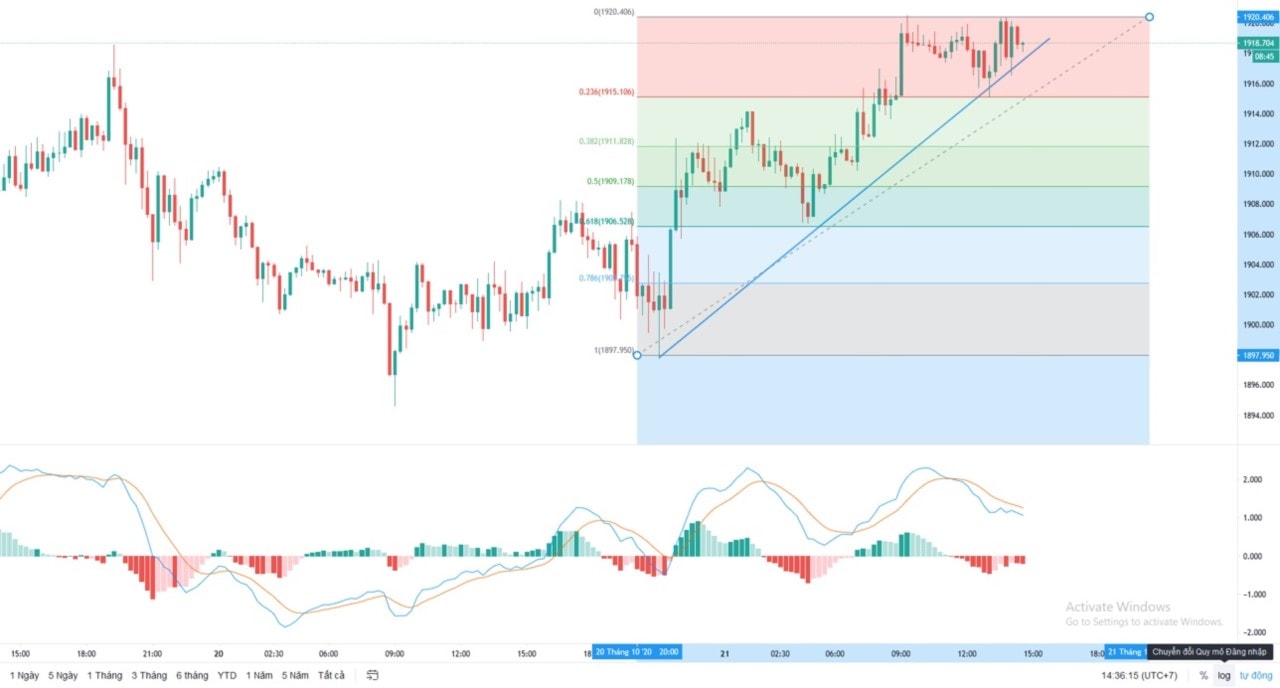
Technical analysis in forex is the study of price movements in a currency market. Accordingly, traders use historical patterns, price charts, and mathematical indicators to predict future price trends. It is a visual representation of the market’s performance in the past and at the present. In simple terms, traders use this information in the form of price action, indicators, and patterns to predict and inform future trends before entering a trade.
This is a very popular approach for all traders, thanks in part to the advancement in charts and trading platforms. However, for someone who is new to the Forex market, understanding indicators or charts and how to use them effectively and accurately is not easy. Unlike fundamental analysis, which examines economic reports like GDP and interest rates, technical analysis focuses directly on price. By doing so, it assumes that all fundamental factors are already priced in, leaving the chart as the ultimate source of truth.
The Role of Market Psychology
Price charts are not just numbers; they represent human psychology. Every candle reflects the collective emotions of greed, fear, and uncertainty of millions of participants. When these emotions trigger buying or selling, they form recognizable visual patterns. By studying these patterns, technical analysts anticipate potential shifts in supply and demand.
The Foundations of Technical Analysis: Charles Dow’s Core Premises
Modern technical analysis is built on Dow Theory, developed by Charles Dow in the late 19th century. Dow identified patterns in market behavior that formed three core premises:
1. Price Discounts Everything
The current price of a currency pair reflects all available information, including macroeconomic data, political events, and market sentiment. Therefore, a technical analyst believes that analyzing fundamentals separately is redundant, as their net impact is already integrated into the real-time price on the chart.
2. Price Moves in Trends
Price movements are not random; they move in trends that are more likely to continue than reverse. Trends are classified into:
- Uptrend: Higher highs (HH) and higher lows (HL). Buyers are in control.
- Downtrend: Lower highs (LH) and lower lows (LL). Sellers are in control.
- Sideways/Ranging Trend: Price fluctuates within a horizontal range, showing market equilibrium.
3. History Repeats Itself
Price patterns repeat because human psychology (fear, greed, herd behavior) remains constant. Recognizable structures like Double Tops or Head and Shoulders repeat over time. Identifying these patterns early allows traders to forecast future market directions.

The Forex Trader’s Canvas: Chart Types
Charts are the key to technical analysis. This is because the most important metric of previous markets and current performance is the price. This is the starting point when diving into a transaction’s potential analysis. Price action can be represented on the chart as this is the clearest indication of how the price is doing. Charts help to identify the general trend whether the market is trending up or down, long-term or short-term, or to define sideways conditions. To analyze price movements, forex traders rely on three primary types of charts:
Line Charts
A line chart connects the closing prices of a currency pair over a specific period. It is simple, filters out market noise (intraday volatility), and gives a clean, high-level view of the trend. However, it hides detail like open, high, and low prices.
Bar Charts (OHLC)
Bar charts provide more detail by displaying the Open, High, Low, and Close (OHLC) prices. The vertical line shows the high and low, while horizontal ticks on the left and right show the open and close prices, respectively.
Candlestick Charts
Developed in Japan, candlestick charts display OHLC data with a colored “real body” between the open and close. The thin lines above and below the body are wicks or shadows, indicating high and low prices. Bullish candles are green/white (close is higher than open), and bearish candles are red/black (close is lower than open). Master the basics of charts, and you can begin using indicators to aid in trend identification.

- Notes: Technical analysis is highly subjective. That means for the same chart, each person may have his own perspective. A support level for one trader might be a breakout zone for another.
The Pillars of Chart Analysis: Support & Resistance
Support and Resistance (S/R) levels are the structural pillars of technical analysis, marking zones where supply and demand meet.
Support (The Floor)
Support is a price level where buying interest is strong enough to overcome selling pressure. As price falls to support, it becomes attractive to buyers, demand exceeds supply, and the price bounces upward. It acts as a horizontal floor.
Resistance (The Ceiling)
Resistance is a price level where selling pressure overcomes buying interest. As price rises, sellers take profits or short the market, creating a ceiling that halts upward momentum.
The Role Reversal Principle (S/R Flip)
When price breaks resistance, that level often becomes a new support level during subsequent pullbacks. Conversely, broken support frequently acts as resistance during pullbacks, reflecting a shift in trader psychology.
Schools of Technical Analysis: Price Action vs. Technical Indicators
There are 2 main schools of technical analysis in the market. They are: Using indicators and Using no indicator.
Using No Indicator: The Price Action School
Using no indicator: traders only use plain charts without any supportive indicators. They analyze the chart based on price behavior. Known as Price Action Trading, this approach focuses on raw candles, support/resistance, and market structure. Price action traders avoid indicators, believing they are lagging by nature because they calculate past price points.

Using Indicators: The Indicator-Based School
Using indicators: there are many different types of indicators such as MACD, RSI, MA, EMA, etc. Each trader will choose his own suitable indicators. From there, they will build the most effective trading system. Indicators apply mathematical calculations to historical data to generate signals, classified into:
- Trend Indicators: Moving averages (SMA/EMA) identify trend direction and dynamic support/resistance.
- Momentum Indicators (Oscillators): RSI and Stochastics measure speed of price and identify overbought (>70) or oversold (<30) zones.
- Volatility Indicators: Bollinger Bands and ATR measure price fluctuations, assisting in breakout identification and stop-loss placement.
- Volume Indicators: Forex tick volume indicators (like OBV) help verify currency trend strength.

To compare the two schools, consider the key features in the table below:
| Feature / Attribute | Price Action Trading (Naked Charts) | Indicator-Based Trading |
|---|---|---|
| Definition | Analyzing naked price charts using candles, swing points, and market structures. | Applying mathematical formulas (lagging or leading) to price and volume data. |
| Lag Factor | Minimal lag; entries and exits are based on real-time price developments. | Inherent lag; formulas process past prices, meaning signals occur after price moves. |
| Complexity | Requires subjective pattern recognition, market structure reading, and experience. | Often rule-based and objective, but can lead to “analysis paralysis” from over-complication. |
| Tools Used | Support/resistance, trendlines, Fibonacci levels, candlestick shapes, chart patterns. | Moving Averages (SMA/EMA), Relative Strength Index (RSI), MACD, Bollinger Bands, ATR. |
| Market State Adaptability | Highly adaptive; instantly displays transitions from trending to ranging structures. | Can yield false signals during sideways consolidation (whipsaws) or lagging signals in fast trends. |
Different indicators are applied to the charts in order to determine the proper entry and exit points. This is to maximize the trading potential with a good return to risk ratio. Many traders use a hybrid system—drawing structural levels via Price Action and utilizing indicators for entry triggers.

Benefits of This Analysis Methodology
- It can be applied to any market using any timeframe. Principles remain identical whether scalping or swing trading.
- Technical analysis can be used as an independent method. A trader can successfully execute trades based entirely on price movements.
- It allows traders to identify trends in the market, ensuring you align trades with dominant momentum.
- It provides clear rules for risk control. Major support and resistance zones help identify where a trade setup is invalidated, allowing precise stop-loss placement.

Crucial Risk Management: Protecting Your Capital
No matter how sophisticated your analysis, technical setups only define probabilities, not guarantees. This makes risk management the difference between survival and ruin.
The Danger of Martingale and Grid Averaging Systems
A common mistake among beginners is utilizing high-risk strategies like Martingale (doubling position size on losses) or grid averaging (buying more as price moves against you). While they yield high short-term win rates in sideways markets, a strong, sustained trend in one direction will eventually happen. If you keep adding to a losing trade, a single prolonged trend will wipe out your entire account. Technical analysis should define where you are wrong, rather than being used to hold losing trades.
Safe Risk Parameters for Forex Traders
Instead of doubling down, professionals use strict, rule-based parameters:
- The 2% Rule: Limit risk per trade to 1% or 2% of account equity. A string of losses will not wipe you out.
- Technical Stop Loss: Place stops slightly past levels where your technical pattern is logically invalidated (e.g., below support for a long trade).
- Risk-to-Reward (R:R) Ratio: Aim for at least 1:2 R:R, so your winning trades are twice the size of your losing trades.
- Volume-Verified Entries: Wait for confirmations like pin bars forming at major levels, coupled with high tick volume.
Summary
Technical analysis is an extremely useful method of trading. However, you need to be patient and serious to practice before it can be effective. There is absolutely no “holy grail” in the Forex market. By combining the foundational premises of Dow Theory, understanding market structures through support and resistance, and selecting a trading style that fits your psychology, you can build a sustainable edge. The key to long-term success is executing high-probability setups while strictly managing your risk.
Register an Exness account NowGet $1,000 Free for beginners
Frequently Asked Questions (FAQ)
Is technical analysis in forex better than fundamental analysis?
Neither is objectively better. Fundamentals explain “why” markets move over the long term, whereas technicals show “what” price is doing and “when” to enter or exit. Many traders combine both for optimal results.
Can technical analysis predict the future with 100% accuracy?
No. Technical analysis measures probabilities, not certainty. Because setups fail, strict risk management and stop-loss orders are mandatory.
Why does history repeat itself on forex charts?
History repeats because human psychology remains constant. Fear, greed, and herd behavior dictate decisions, forming recognizable, repeating patterns on charts.
What is the difference between lagging and leading indicators?
Lagging indicators (e.g., Moving Averages) follow price to confirm trends. Leading indicators (e.g., RSI) anticipate reversals by measuring speed and momentum.
Why are Martingale and grid strategies dangerous for technical traders?
They involve adding to losses, which leads to exponential drawdowns during strong trends, ultimately resulting in account liquidation.


I just like the valuable information you provide in this article.
Hai sir. very good work keep going on
This is cool bc i really wanna get better at reading charts tbh 🙃 i remember one time i was convinced i saw a support level but my friend saw it as resistance wait nvm it was just confusing for me to tell the difference lol its hard to stay optimistic when youre first learning 😭 but i guess thats the journey 🔥
What a great information man