


📌 Key Takeaways
- Market Indecision: A Doji candlestick represents a state of balance between buyers and sellers, where the opening and closing prices are virtually identical.
- Reversal Potential: While neutral on its own, a Doji appearing after a prolonged trend or at key support/resistance levels often signals an impending trend reversal.
- The 4 Key Types: Master the Standard Doji Star (indecision), Long-legged Doji (high volatility), Dragonfly Doji (bullish reversal), and Gravestone Doji (bearish reversal).
- Best Trading Setup: Combine Doji candles with structural **Support and Resistance levels** for 5-minute binary options trades.
- Volume Confirmation: Look for decreasing volume during Doji formation (weakening trend) followed by a high-volume confirmation candle to enter trades.
Some candlesticks have very small or non-existent bodies, but their upper or lower shadows are unusually long. When they appear on a trading chart, they immediately attract attention because of their striking visual difference. Experienced traders use these formations as critical signals to identify trend exhaustion and enter secure transactions. In this article, I will explain what a Doji candlestick is, the market psychology behind its variations, and how to trade it effectively.
Register an IQ Option account NowGet $10,000 Free for beginners
A video introducing how to identify and use Doji candlestick
Watch this visual guide to see how different Doji patterns look on live trading charts and how to set up entry rules:
What is Doji Candlestick?
A Doji candlestick is a single-candle pattern that represents a state of complete indecision in the market. It occurs when the opening price and the closing price of a asset are virtually identical. This creates a cross, inverted cross, or plus sign shape on the chart.
Because it shows that neither the buyers (bulls) nor the sellers (bears) were able to gain control, the Doji is a transitional signal. It is easy to identify when using Japanese candlestick charts to forecast and analyze price action.

The 4 main types of Doji candlesticks
Doji candlesticks are categorized based on the length and position of their shadows:
| Doji Type | Body Position | Shadow Length | Market Meaning |
|---|---|---|---|
| Standard Doji Star | Middle of the range | Short, equal upper/lower | Pure market indecision. Both sides are balanced. |
| Long-legged Doji | Middle of the range | Very long upper/lower | High volatility. Active battle but close ended flat. |
| Dragonfly Doji | At the very top | Very long lower wick, no upper | Bullish reversal. Sellers rejected. |
| Gravestone Doji | At the very bottom | Very long upper wick, no lower | Bearish reversal. Buyers rejected. |

Detailed meaning & Market Psychology
Doji Star: It shows a deadlock between buying and selling forces. The opening price is equal to the closing price, which lies exactly in the middle of the candlestick’s range. When the price hesitates like this, it is a warning to stop and observe before making a move.

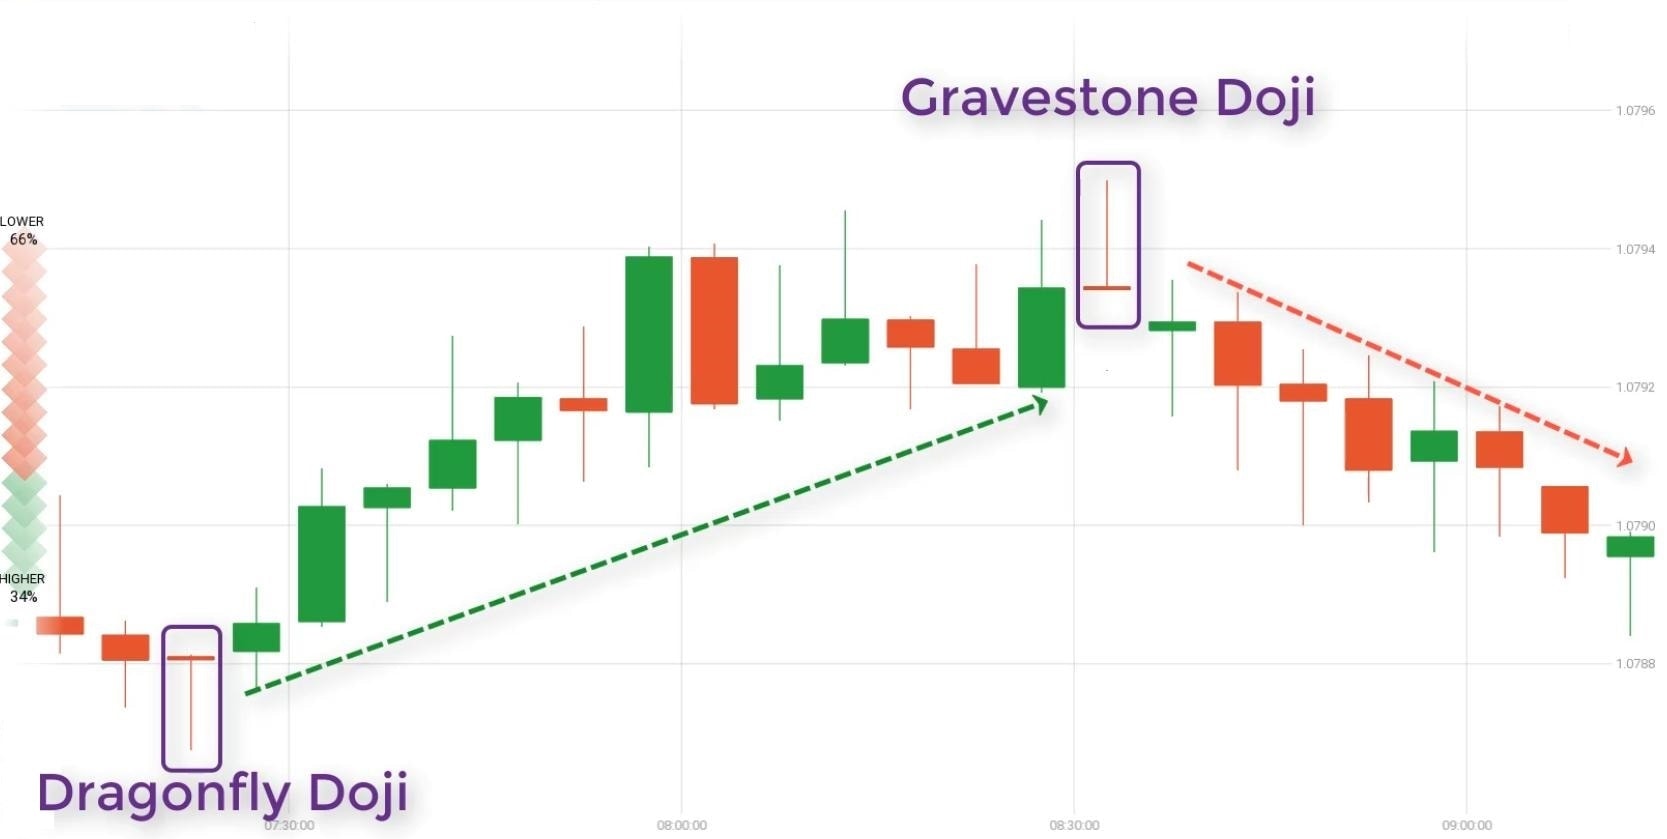
Dragonfly Doji: This pattern shows a strong rejection of lower prices. During the session, the sellers pushed the price sharply lower, but by the close, buyers stepped in aggressively to push the price all the way back to the session high. This candlestick usually appears at the bottom of a downtrend, signaling a strong bullish reversal.

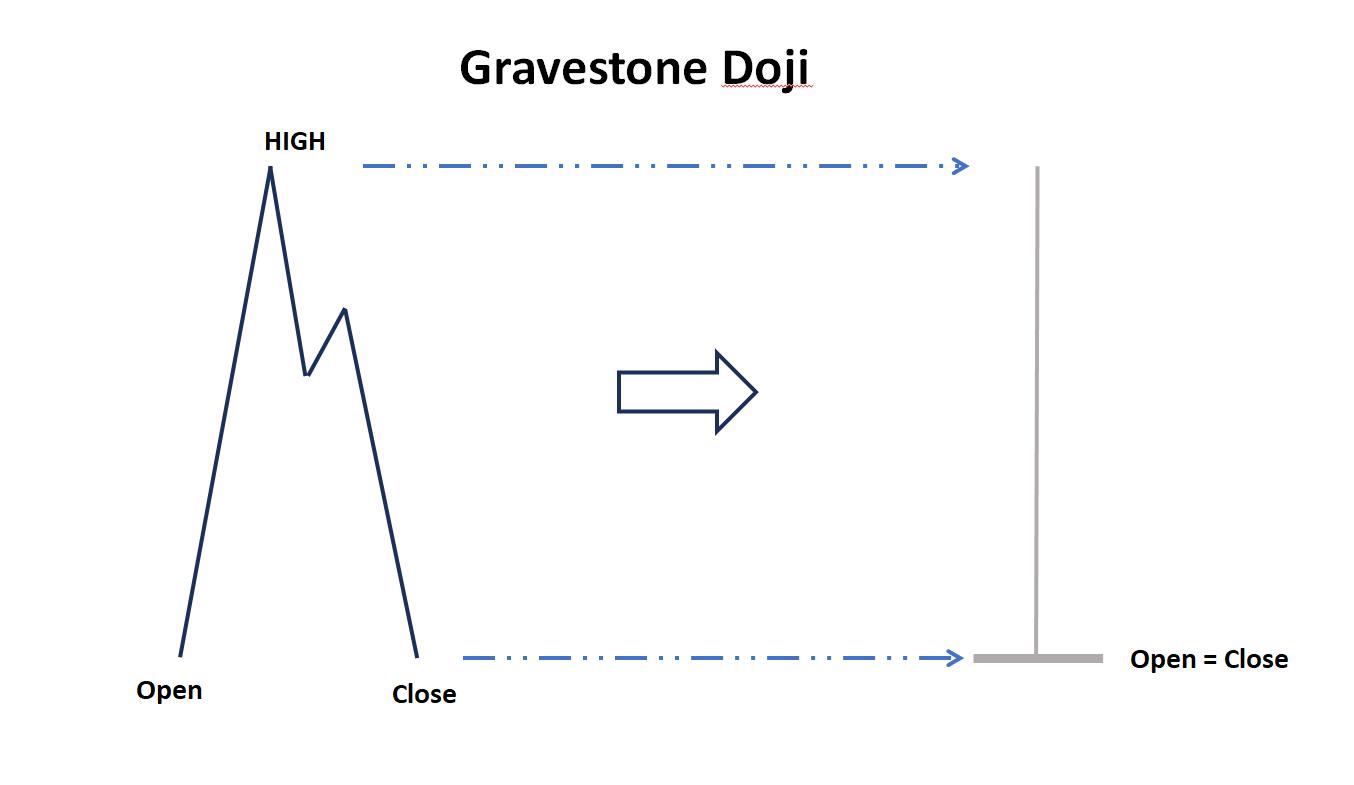
Gravestone Doji: The psychological counterpart to the Dragonfly. Buyers pushed the price significantly higher, but by the close, sellers completely overwhelmed them, driving the price back down to the session low. This pattern usually appears at the top of an uptrend, signaling a bearish reversal.
How to trade with Doji candlesticks: 4 Proven Setups
When a Doji appears after an extended trend, it shows that the momentum is stalling. To trade it with high probability, combine it with key structural levels:
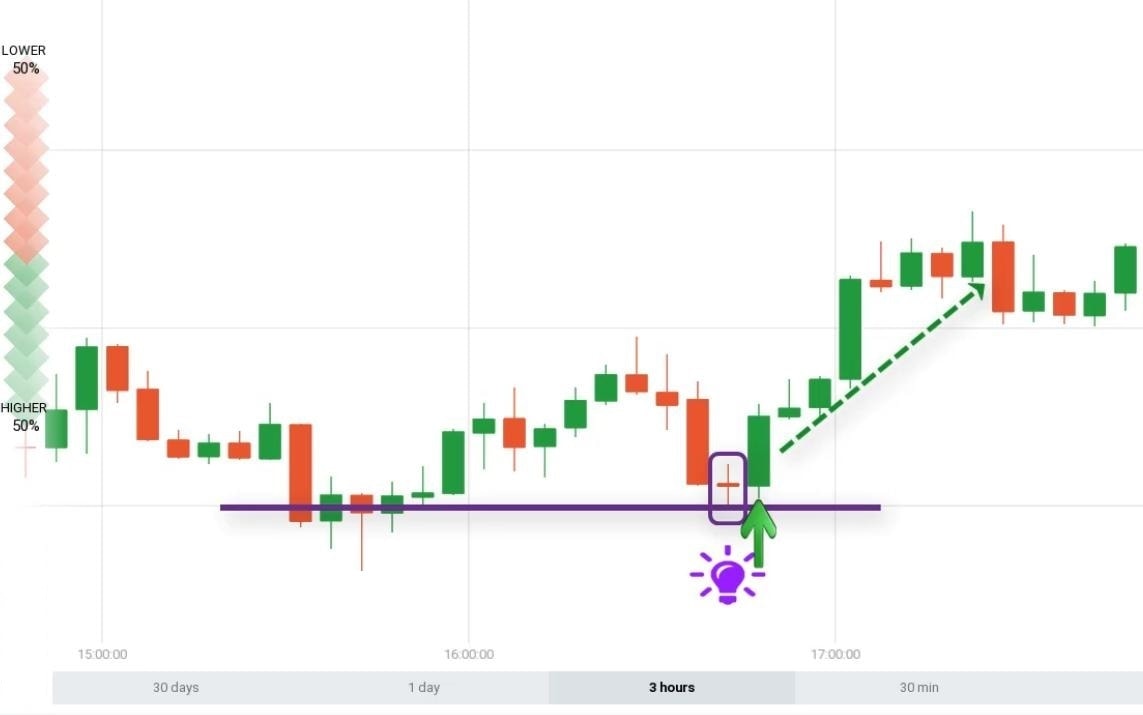
Setup 1: Standard Doji hits Support (UP Trade)
- Conditions: 5-minute Japanese candlestick chart. Expiration time of 5 minutes.
- Trigger: Open an UP option immediately when a standard Doji candle forms directly on a verified Support level.
Setup 2: Standard Doji hits Resistance (DOWN Trade)
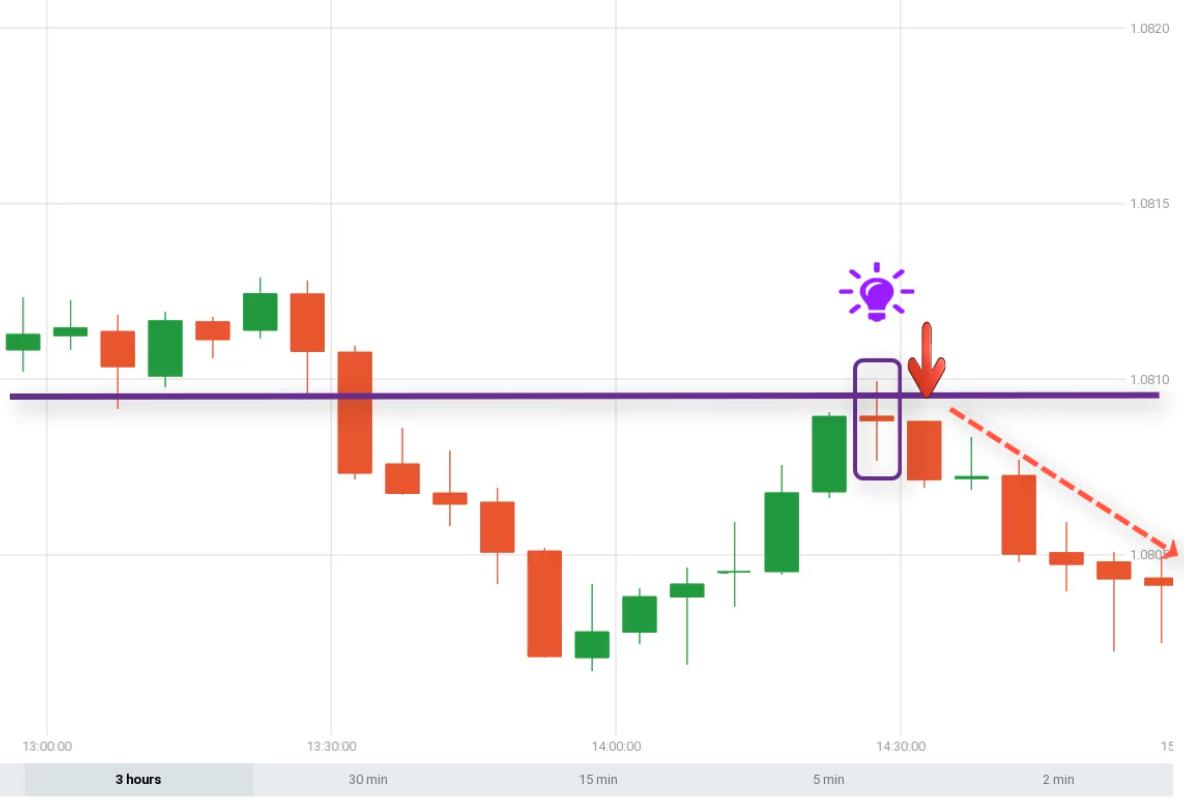
- Conditions: 5-minute Japanese candlestick chart. Expiration time of 5 minutes.
- Trigger: Open a DOWN option when a Doji candle forms directly on a verified Resistance level.
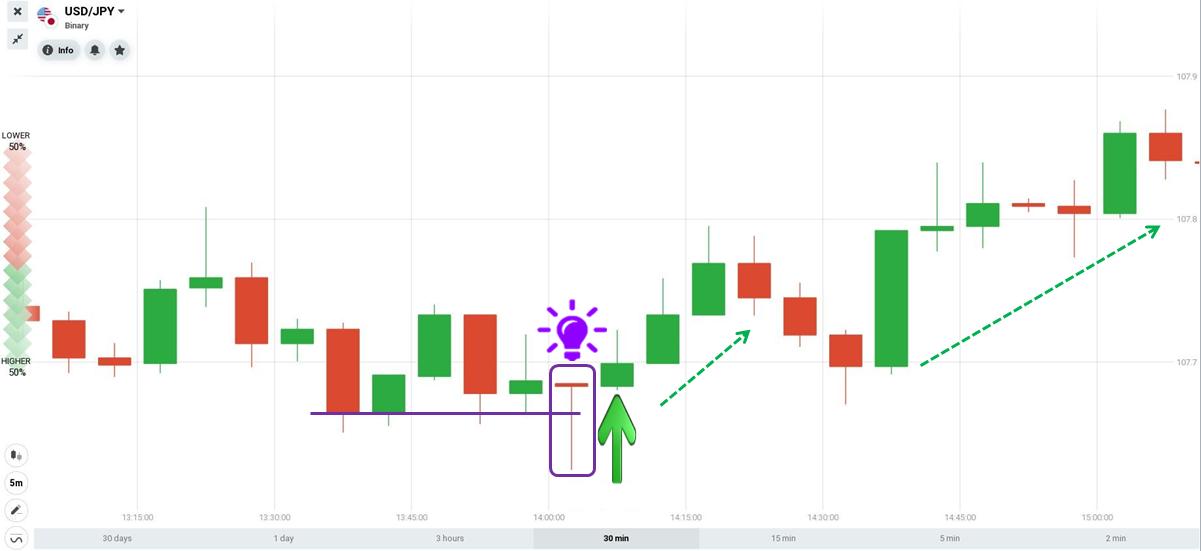
Setup 3: Dragonfly Doji at Support (UP Trade)
- Conditions: 5-minute Japanese candlestick chart. Expiration time of 5 minutes.
- Trigger: Open an UP option when a Dragonfly Doji (long lower wick rejecting low prices) touches the Support zone.
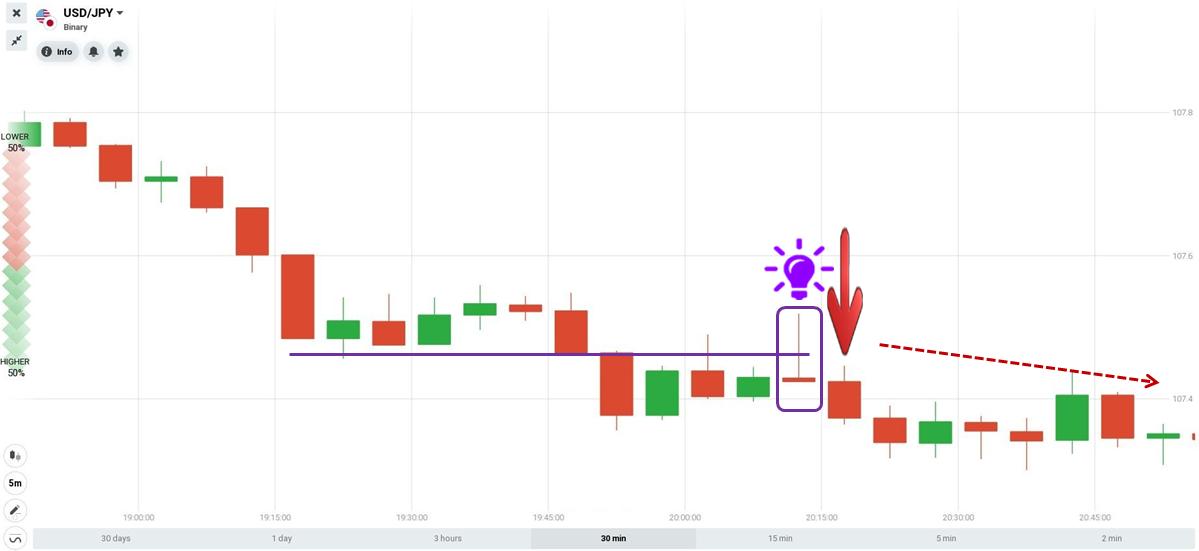
Setup 4: Gravestone Doji at Resistance (DOWN Trade)
- Conditions: 5-minute Japanese candlestick chart. Expiration time of 5 minutes.
- Trigger: Open a DOWN option when a Gravestone Doji (long upper wick rejecting high prices) touches the Resistance zone.
Important notes to remember when trading with Doji
- Look for Lonely Peaks (Gaps): If a Doji candlestick appears with price gaps (windows) before and after it, it is a “baby abandon” type pattern, indicating an extremely high-probability reversal signal.
- Watch the body sizes in sequence: If consecutive candles leading to the Doji are getting progressively shorter, it confirms that the dominant trend is running out of steam.
- Always seek confirmation: Never trade a Doji in isolation. Combine it with momentum indicators like RSI or MACD to confirm the reversal strength.
- Practice patience: First-time traders should practice identifying and executing Doji strategies on a demo practice account before using real money.
Register an IQ Option account NowGet $10,000 Free for beginners
Frequently Asked Questions: Doji Candlestick
Is a Doji candlestick bullish or bearish?
A standard Doji is neutral because the closing price equals the opening price. However, its context is what determines its bias. If it occurs after a strong uptrend or at resistance, it is bearish. If it occurs after a downtrend or at support, it is bullish.
What is the difference between a Doji and a Spinning Top?
Both candles show indecision. However, a Doji has virtually no real body (the open and close are identical or very close), whereas a Spinning Top has a small, visible real body with short shadows.
Why does a Dragonfly Doji signify a bullish reversal?
A Dragonfly Doji has a long lower shadow. This shows that sellers were active during the session and drove the price down, but buyers rejected those low prices and pushed the market all the way back to the opening level by the close. This rejection shows strong buying support.
Can I use Doji candles on a 1-minute chart?
While Doji candles form on 1-minute charts, they are highly prone to false signals due to market noise. It is recommended to use at least a 5-minute chart or higher for reliable setups.
About the Author
This guide was written by the How To Trade Blog analysis team. We specialize in break-down tutorials of Japanese candlestick patterns to help retail traders execute trades with statistical edges. Trading involves risk of capital loss.

, market psychology, and high-probability trading strategies.)