
Key Takeaways
- Core Structure: A downtrend is defined by a consistent sequence of lower highs (LH) and lower lows (LL).
- Dynamic Resistance: Drawing a downtrend line connects descending swing highs. A third touch confirms its validity.
- The Pullback Rule: Wait for corrective pullbacks to resistance zones before entering. Do not chase drops.
- Risk Warnings: Avoid averaging down, grid systems, and Martingale. These systems risk account blowouts.
- Professional Risk: Apply the 2% maximum risk rule, target a 1:2 R:R ratio, and use hard stop-losses.
The trend is a favorite dish of professional traders. As long as the market has a clear trend, they will probably make money. In the previous article, I mentioned everything about an uptrend. And now, I’ll introduce you to the downtrend, the market psychology behind it, and how to open safe Forex orders with a downtrend.
Register an Exness account NowGet $1,000 Free for beginners
What is a downtrend in Forex? What are its common features?
A downtrend is the bearish trend of the market where price keeps falling, creating lower lows and lower highs. In technical analysis, this is known as a Bear market.
To understand what is a downtrend, we must examine the balance of supply and demand. It is a period where sellers (bears) are firmly in control. The cycle begins with institutional distribution, where major players unload their positions. As supply rises and demand dries up, price falls, triggering panic selling among retail traders. This results in the public participation phase, where the price drops aggressively, punctuated by weak, low-volume corrective pullbacks before sellers push the price down once again.
Common features of a downtrend
To identify a valid downtrend, the price chart must meet two strict structural conditions:
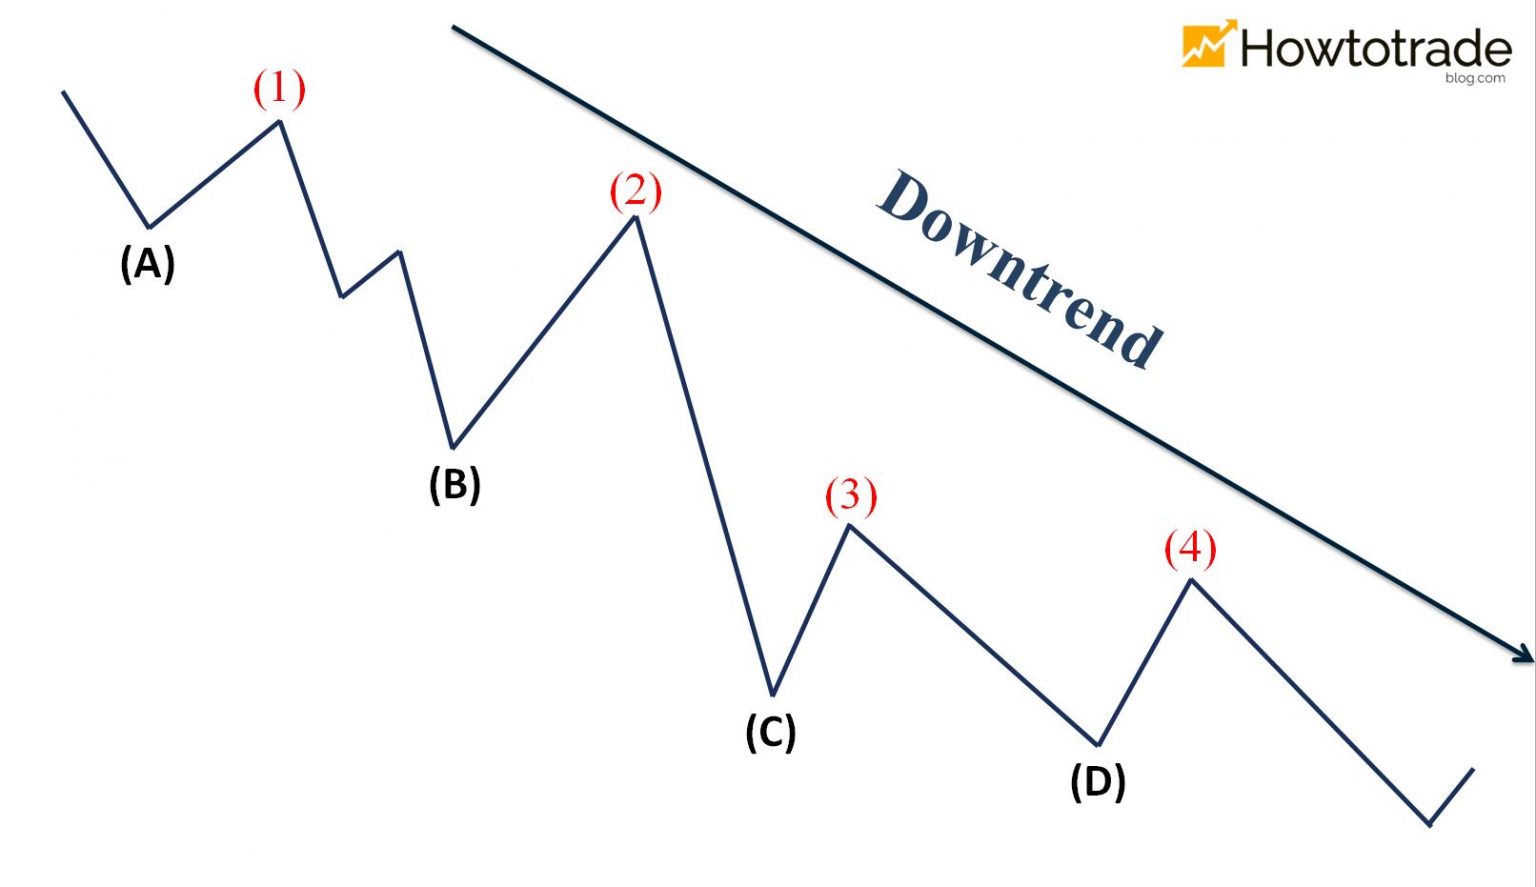
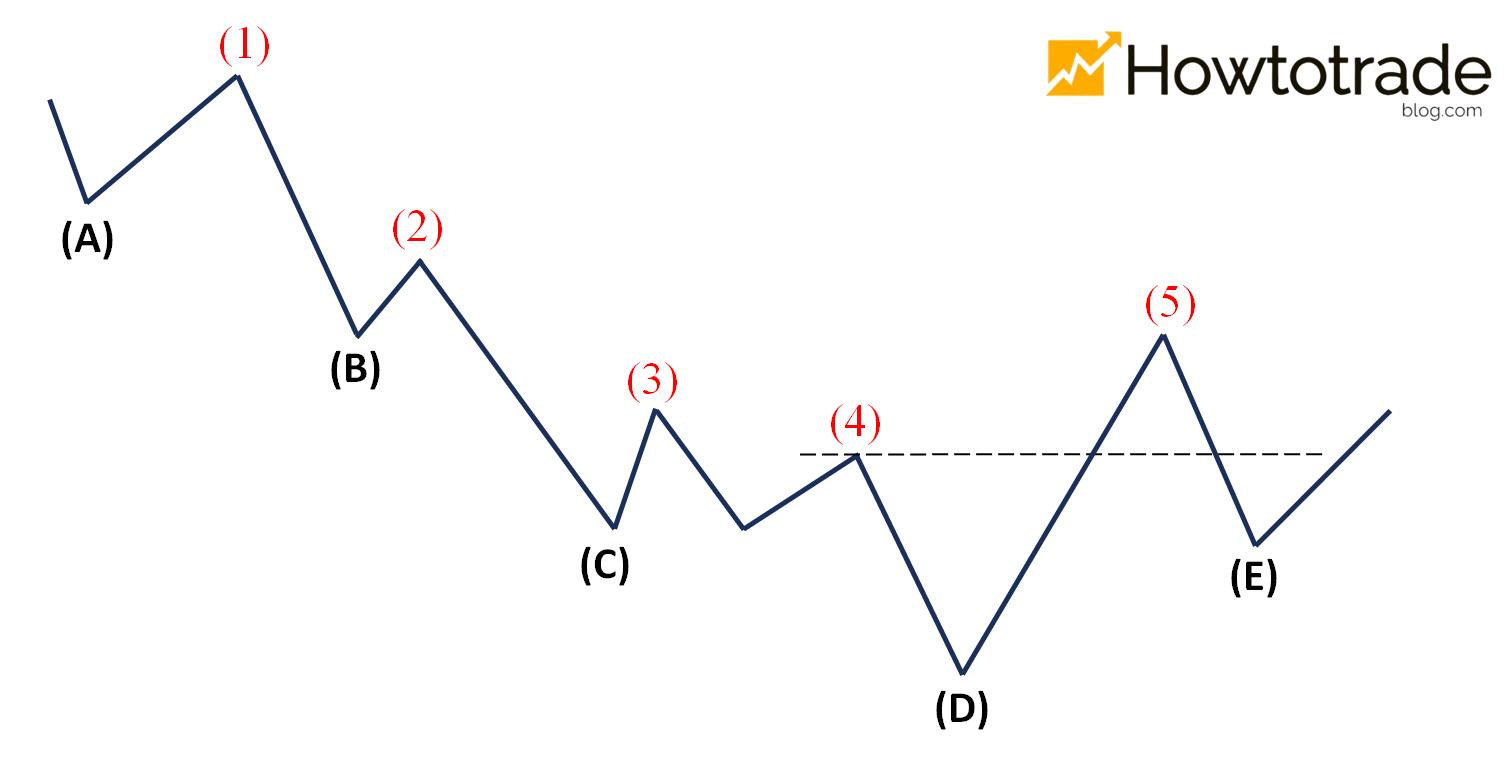
+ Lower Lows (LL): The following trough is lower than the previous trough. Trough (B) is lower than trough (A) and trough (C) is lower than trough (B). These lower lows confirm that sellers are maintaining enough momentum to breach historical support levels.
+ Lower Highs (LH): The following peak is lower than the previous peak. Peak (2) is lower than peak (1) and peak (3) is lower than peak (2). These lower highs demonstrate that buyers are failing to push the price past previous resistance zones, indicating that sellers are defending their positions at lower prices.
When both signals appear, the market has entered a downtrend. If you only see lower peaks but the price respects a horizontal support line, the market is in a descending triangle, not a downtrend. Both conditions must be met in sequence to validate a true bearish trend.
Common patterns of a downtrend
Downtrends do not always look identical on a chart. Depending on volatility and market participants, the bearish trend can develop in different ways. Understanding these patterns helps you select the correct strategy.
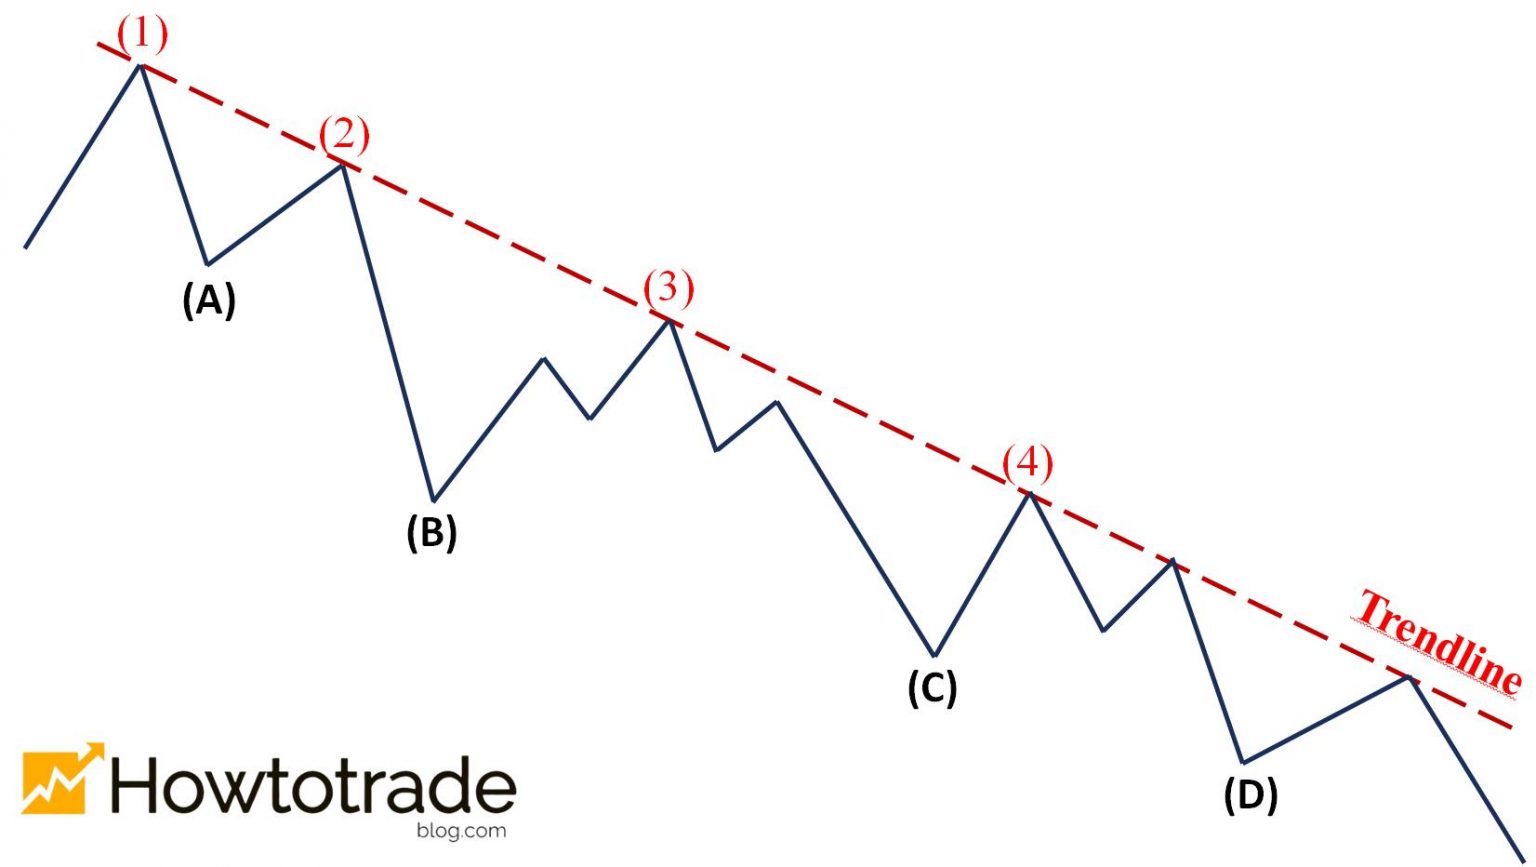
Pattern 1: A downtrend in which you can draw a trendline
This is the classic downtrend pattern. The price declines in an orderly manner, forming clear pullbacks that align along a single diagonal line.
What is a trendline? In a downtrend, the bearish trendline connects the peaks together, acting as a dynamic resistance level. To draw a valid trendline, connect at least two peaks, with a third touch confirming the line’s validity. Draw a straight line downwards connecting the peaks. When the price touches the trendline, it will fall back, offering a high-probability entry point.
Pattern 2: The price breaks out of the support, drops, and enters a downtrend
This is a recognizable downtrend pattern that is very popular in the market. The price initially moves sideways, establishing a clear horizontal support level. Sellers eventually gain control and push the price below the support line, initiating a downtrend.
After the breakout, the price pulls back up to retest the broken support. Under the role-reversal principle, the broken support level now acts as a new resistance level. Once the price retests this resistance and rejects it, the downtrend structure is confirmed, creating a safe sell entry zone.

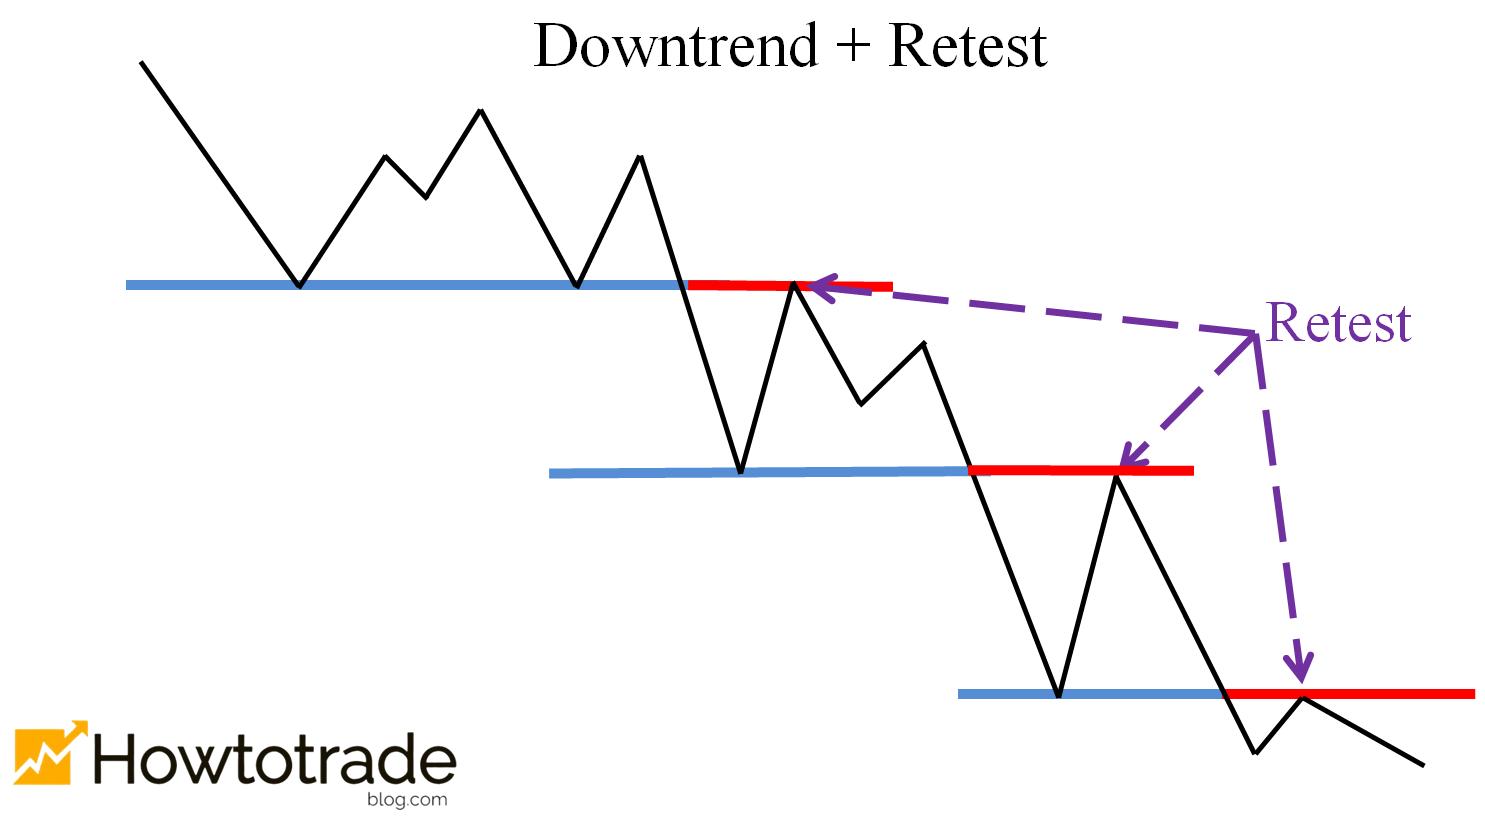
Pattern 3: Downtrend and Retest
This is also one of the very common patterns when the market forms a downtrend. The price will keep falling, creating lower troughs after troughs. Instead of a single breakout, the price undergoes a repetitive cycle. Each time the price falls out of a trough (breaking support), it will pull back and retest that trough (which now acts as resistance). It will then continue to fall. This process repeats itself many times, forming a clear step-like progression down the chart.
Pattern 4: The ladder downtrend pattern
The price goes down, then sideways, and then goes down again. In general, you will realize that this is a downtrend. But you will not know how and when to open an order safely. This pattern is characterized by sharp drops followed by flat, horizontal consolidation steps. The sideways consolidation represents a temporary equilibrium between buyers and sellers. When the range support is finally broken to the downside, the price drops quickly to the next level. Trading this pattern requires patience, as trading inside the range often leads to losses.

Practical examples of patterns in a downtrend
Let’s examine how these theoretical models appear on real trading charts. Recognizing these patterns in real market conditions is essential for applying correct strategies.
1. Draw a Trendline in a downtrend
In this chart, we connect three descending peaks. By drawing a straight line through these swing highs, we create a bearish trendline. Notice how each time the price rallies back to touch this line, it gets rejected and falls back, making a new lower low. The trendline serves as a dynamic boundary. When drawing trendlines, always connect the outer edges of the candle wicks. Do not cut through candle bodies, as this distorts the structural levels.

2. The price breaks out of the support and goes down
In this example, the price forms a clean horizontal support line. After testing this line multiple times, a strong bearish breakout candle closes decisively below it. The price then returns to the broken support level, which acts as resistance. This retest is rejected, confirming the breakout, and the price drops rapidly, validating the new downtrend structure.

3. Downtrend and retest
Here, the step-by-step structure is very clear. The price falls, sets a low, pulls back, and then breaks the low. The subsequent pullback returns to the broken low, retesting it as resistance. This process repeats, showing a series of clean retests of previous troughs, offering multiple high-probability entry points for trend followers.

4. The ladder downtrend pattern in practical
On this chart, we see the stair-stepping behavior of the ladder pattern. The price drops sharply, consolidates in a flat range, and then drops again. Notice how the horizontal boxes represent consolidation steps. When trading this pattern, wait for the price to close below the consolidation box support before entering a sell trade.

When is a downtrend over?
Answers: It is when the principles of a downtrend are broken. The previous peak and trough are no longer lower than the previous ones => The downtrend has ended. Under technical analysis concepts, this is known as a Market Structure Shift (MSS) or Change of Character (CHoCH).
During a healthy downtrend, the price must make lower highs (LH) and lower lows (LL). The first warning sign of a reversal is a failure to create a lower low. This is often called a higher low (HL) or a double bottom. However, this alone does not end the trend. The downtrend is officially over when the price breaks and closes decisively above the last structural lower high (LH), creating a new higher high (HH).
When a downtrend ends, the market will likely fall into two cases. It will either move sideways (accumulation phase) or reverse and return to an uptrend. In both cases, you must stop looking for sell orders and wait for the market to establish a new structure.
Healthy Downtrend vs. Reversal Signs
To help you distinguish between a healthy continuing downtrend and warning signs of a trend reversal, review this comparative breakdown:
| Market Feature | Healthy Downtrend | Trend Reversal Signs |
|---|---|---|
| Highs & Lows | Continuous sequence of Lower Highs (LH) and Lower Lows (LL). | Failure to make a new LL (Double Bottom or Higher Low), followed by a Higher High (HH). |
| Price Action Signals | Strong bearish momentum candles (Marubozu) at breakouts; bearish rejection wicks at trendline. | Bullish engulfing candles, hammer patterns, or morning stars forming at key levels with high volume. |
| Trendline & Moving Averages | Price stays safely below the downward-sloping trendline and moving averages (e.g., 20/50 EMA). | Decisive candle close above the bearish trendline and moving averages slope turns flat or positive. |
| Volume Characteristics | High volume on downward moves; low volume on corrective pullbacks. | Declining volume on downward moves; surging volume on upward breakouts. |
| Support Retests | Broken support levels consistently act as new resistance (role reversal). | Broken resistance levels begin to act as new support zones. |
Rules for opening orders in a downtrend
The trend is our friend. Please repeat this quote when you open the candlestick chart and start trading. The trend is a “close friend”. Just follow it and trade. And in a downtrend, you should only open SELL orders. Trading with the dominant trend aligns your trades with the path of least resistance. Trying to buy the bottoms is extremely risky and is a recipe for quick losses.
All you need to do to make money in this market is to wait for the trend and follow the discipline. Uptrend = BUY. Downtrend = SELL. In a downtrend, if the price pulls back, do not look to buy the pullback. Instead, treat it as an opportunity to find a better, higher entry price for a sell position. Let the buyers exhaust themselves, and wait for sellers to step back in before placing your order.
Crucial Warning: The Danger of Averaging Down
One of the most destructive habits of retail traders is averaging down in a downtrend without a stop loss. When a trade goes against them, they open additional buy positions at lower prices, hoping for a market pullback. Some even double down using a Martingale approach. This strategy is highly risky. A strong bearish trend can continue for a long time, leading to margin calls and blown accounts. Always steer clear of these dangerous methods and stick to professional risk management rules:
- The 2% Rule: Never risk more than 1% to 2% of your trading capital on any single trade. Determine your position size based on your stop-loss distance, ensuring that your maximum loss is strictly capped.
- Risk-to-Reward Ratio: Maintain a minimum R:R of 1:2. This ensures that your profitable trades outsize your losing ones, keeping you profitable even with a 40% win rate.
- Volume Verification: Only enter trades when breakouts or retests show clear volume-verified momentum, confirming institutional sellers are active.
Three entry signals in a downtrend
The trading formula in a downtrend is you must only open SELL orders. However, you should not just sell blindly the moment you open your chart. Doing so is gambling. Instead, you must wait for high-probability structural signals to confirm that sellers are active at your key levels. There are 3 extremely important signals to watch out for:
Signal 1: Reversal candlestick patterns from bullish to bearish
The price will keep falling in a downtrend. Combined with bearish candlesticks, your trades will be a lot safer. When the price pulls back upward to a key resistance zone (such as a trendline or a horizontal resistance level), we do not immediately enter a trade. We wait for a bearish reversal candlestick pattern to print. This candle acts as confirmation that buyers have exhausted their momentum and sellers have re-entered the market.
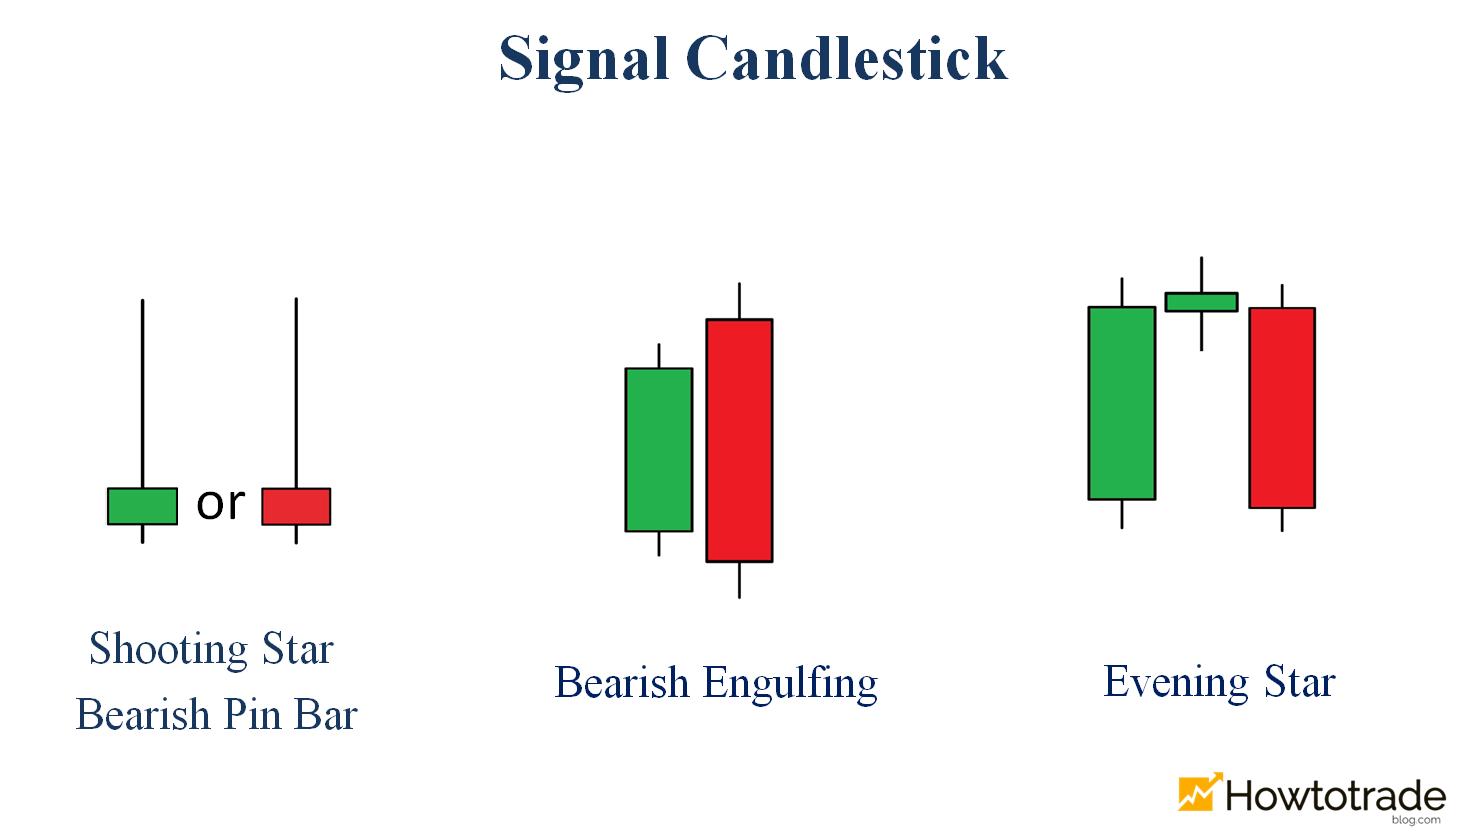
I will list out 3 bearish reversal candlesticks with the highest accuracy. They are Bearish Pin Bar (Shooting Star), Bearish Engulfing, and Evening Star. These are the standard signals for you to act in a downtrend. A Bearish Pin Bar shows a long upper wick, indicating price rejection at the level. A Bearish Engulfing shows a large red body completely wrapping the previous green candle, indicating a strong momentum shift. An Evening Star is a three-candle pattern showing a transition from bullish to bearish control.
Signal 2: The price breaks out of the support and goes down forming a downtrend
In most cases, the price will create a long candlestick to definitively break out of the support and go down => forming a downtrend. This breakout candle must close clearly below the horizontal support line, with a strong bearish body and minimal lower wick. A weak breakout candle that wicks back above the support line is often a fakeout (liquidity grab). A clean, definitive close below the support level is a strong signal that sellers have taken control of the market and that you should focus on finding sell entries.

Signal 3: The price retests in a downtrend
When the market enters a downtrend, the price will keep falling, creating lower troughs after troughs. And each time the price falls out of a trough, it will probably retest the trough just crossed. I often call them levels in a downtrend. A retest is a low-risk opportunity to enter a trade because the structure is already established. By waiting for the price to return to the broken trough level, you can observe whether sellers defend this zone. If they do, it confirms the level is valid, and you can place a sell order with a tight stop loss.

How to trade Forex most effectively with a downtrend
You must really grasp the 3 signals above. That is the point of whether you should open an order or not. And now, I’ll go into detail.
Strategy 1: Trade Forex with the Trendline in a downtrend
This is the most effective strategy when you can draw a Trendline. The only requirement is for the price to touch the Trendline and go down. When one of the three signal candles appears, open a SELL order.
Waiting for the price to pull back to the trendline gives you a premium price, maximizing profit potential and minimizing risk.
- Entry Point: Right after the price finishes creating a signal candlestick pattern like Evening Star (or Bearish Engulfing, Bearish Pin Bar) while touching the Trendline.
- Stop-Loss: At the nearest peak before the price touches the Trendline. If the trend breaks, your position is cut early.
- Take-Profit: When the price touches support levels (previous swing lows) formed in the past, where the price may bounce.

Strategy 2: Trade using Retest and Breakout in a downtrend
This is a very safe trading strategy. It is when the price shows signs of breaking out of the support and going down, creating a downtrend. Wait patiently for the Retest point. As soon as the retest appears and the price creates one of 3 signal candlestick patterns that I introduced above, you can consider opening a SELL order as follows:
- Entry Point: Right after the price finishes creating a signal candlestick pattern like Evening Star (or Bearish Engulfing, Bearish Pin Bar) while retesting the newly formed resistance (old support).
- Stop-Loss: At the resistance level that has just been retested by the price. Placed safely above the resistance. If the price breaks back above this level, the breakout was a fakeout, and the trade is no longer valid.
- Take-Profit: You should take profits when the price touches support levels that have been formed in the past. Set at the next major horizontal support level formed in the past.

Strategy 3: Trade by using Trend and Signal
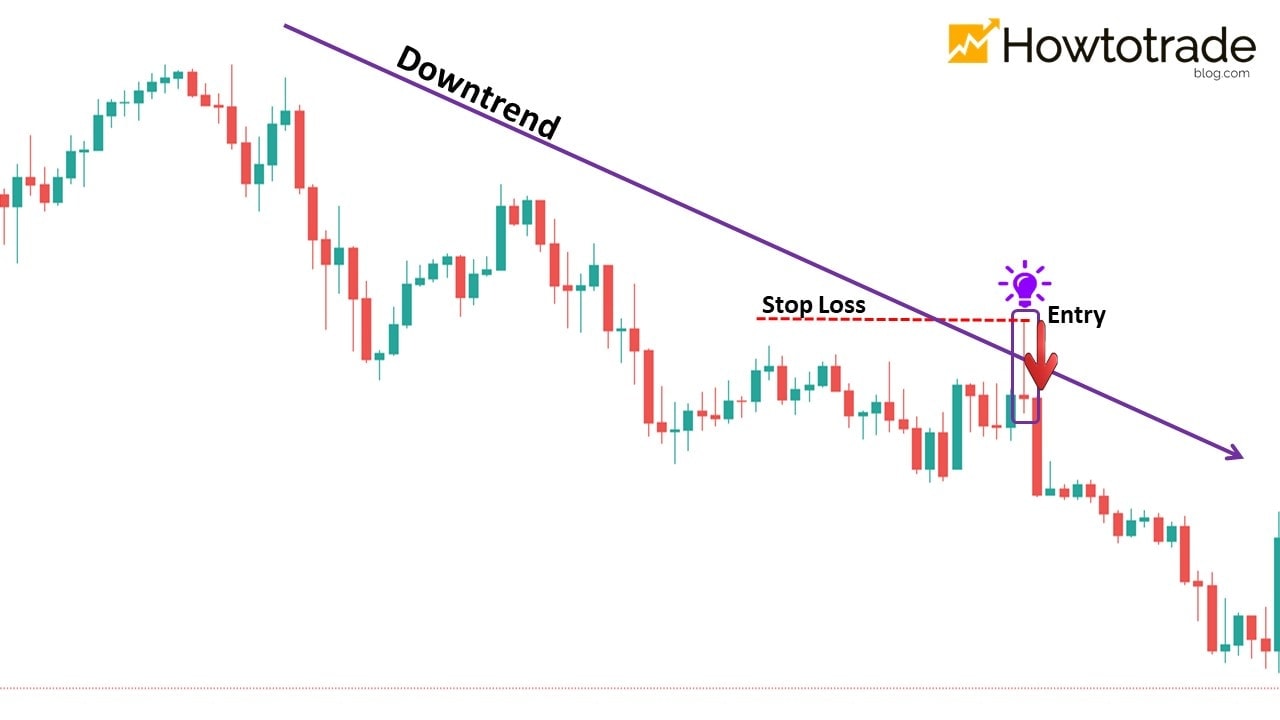
This is a somewhat risky trading style. Its advantage is that it is easy to get a reasonable entry point. You do not wait for a trendline touch or structural retest. Instead, you focus on the dominant Trend and wait for a high-quality confirmation Signal, making it a discretionary approach for experienced traders.
- Entry Point: Right after the price finishes creating a signal candlestick pattern like Evening Star (or Bearish Engulfing, Bearish Pin Bar) in the direction of the primary trend.
- Stop-Loss: At the nearest resistance level in a downtrend. (The example in the picture is the tail/wick of a Bearish Pin Bar candlestick).
- Take-Profit: Set at the nearest swing low support. Ensure there is enough room for the price to fall to target support, yielding at least a 1:2 Risk-to-Reward ratio.
Conclusion
Don’t try to stop a downwards rushing train, it will crush you into pieces. So does a downtrend. When the market goes down, either you follow that trend or you don’t do anything. Going against the trend is “throwing money through the window”. Professional traders do not try to guess the bottom; they wait for the market to establish a clear trend, wait for corrective pullbacks, and follow their disciplined trading rules.
What you need to do in a downtrend is wait for the signal, practice strict capital preservation, and open SELL orders. Never average down, never trade without a stop loss, and let the market structure work in your favor.
Sign up for a Demo account below. Open a Japanese candlestick chart, draw your first bearish trendlines, and verify what you have learned today in a risk-free environment.
I will have many articles to practice this knowledge. Because this is the safest Forex trading strategy that you can apply to a downtrend.
Register an Exness account NowGet $1,000 Free for beginners
Frequently Asked Questions (FAQ)
What is a downtrend in Forex trading?
A downtrend is a bearish market structure characterized by a sequence of lower highs and lower lows. It indicates that supply exceeds demand, with sellers driving the price down over a sustained period.
How do you draw a downtrend line accurately?
Connect the swing highs of the price action. You need at least two peaks to draw the line, and a third touch is required to confirm its validity. Draw it along the outer wicks without cutting through candle bodies.
What is a pullback in a downtrend?
A pullback is a temporary upward correction during a primary downtrend. It represents a brief period where buyers try to push the price up before sellers re-enter the market at key resistance zones to continue the trend.
Why is averaging down in a downtrend highly dangerous?
Averaging down involves opening additional buy positions as the price falls to lower your average entry. This is dangerous because a downtrend can continue indefinitely, causing margin calls and blowing up your account.
When is a downtrend officially over?
A downtrend is over when its structure breaks. This happens when the price fails to make a new lower low (forming a double bottom or higher low), and then closes decisively above the last structural lower high (LH), establishing a higher high.
What is the 2% risk rule in trading?
The 2% rule is a risk management guideline stating you should never risk more than 2% of your trading capital on any single trade. It ensures that a series of consecutive losses will not severely damage your account balance.


