📌 Key Takeaways
- Reversal Signal: The Three Inside Up is a 3-candle bullish reversal pattern occurring at the bottom of a downtrend.
- Structure: It consists of a large bearish candle, followed by a smaller bullish candle contained within the first, and a third bullish candle closing above the first candle’s open.
- Bullish Harami Origin: It is effectively a confirmed Bullish Harami pattern, where the third candle acts as the confirmation trigger.
- Best Trading Combinations: Trade this pattern near key Support levels or above the SMA30 trendline for highest accuracy.
- Variations Exist: Small differences in body size are acceptable as long as the third candle closes above the high of the first candle.
In addition to easy price observation, the advantage of using a Japanese candlestick chart is providing highly accurate candlestick patterns. Experienced traders often consider Japanese candle patterns as reliable entry signals. Candlestick patterns consisting of multiple candles, such as the Three Inside Up, offer high accuracy and effectiveness because they represent a multi-stage shift in market sentiment.
This article will answer in detail what a Three Inside Up candle pattern is. We will analyze its characteristics, market psychology, variations, and how to trade using this pattern in binary options and forex trading.
Register an IQ Option account NowGet $10,000 Free for beginners
A video about Three Inside Up candlestick pattern
Watch this visual analysis video to see the pattern in action on live trading charts:
What is Three Inside Up candle?
The Three Inside Up is a bullish reversal candlestick pattern that usually appears at the end of a downtrend. It indicates that the selling momentum has exhausted itself, the downtrend is likely over, and a new uptrend has begun.
Structurally, this pattern is a confirmation of the Bullish Harami pattern. While a standard Harami only suggests a potential pause or reversal, the addition of the third bullish candle confirms that buyers have taken full control of the price action.
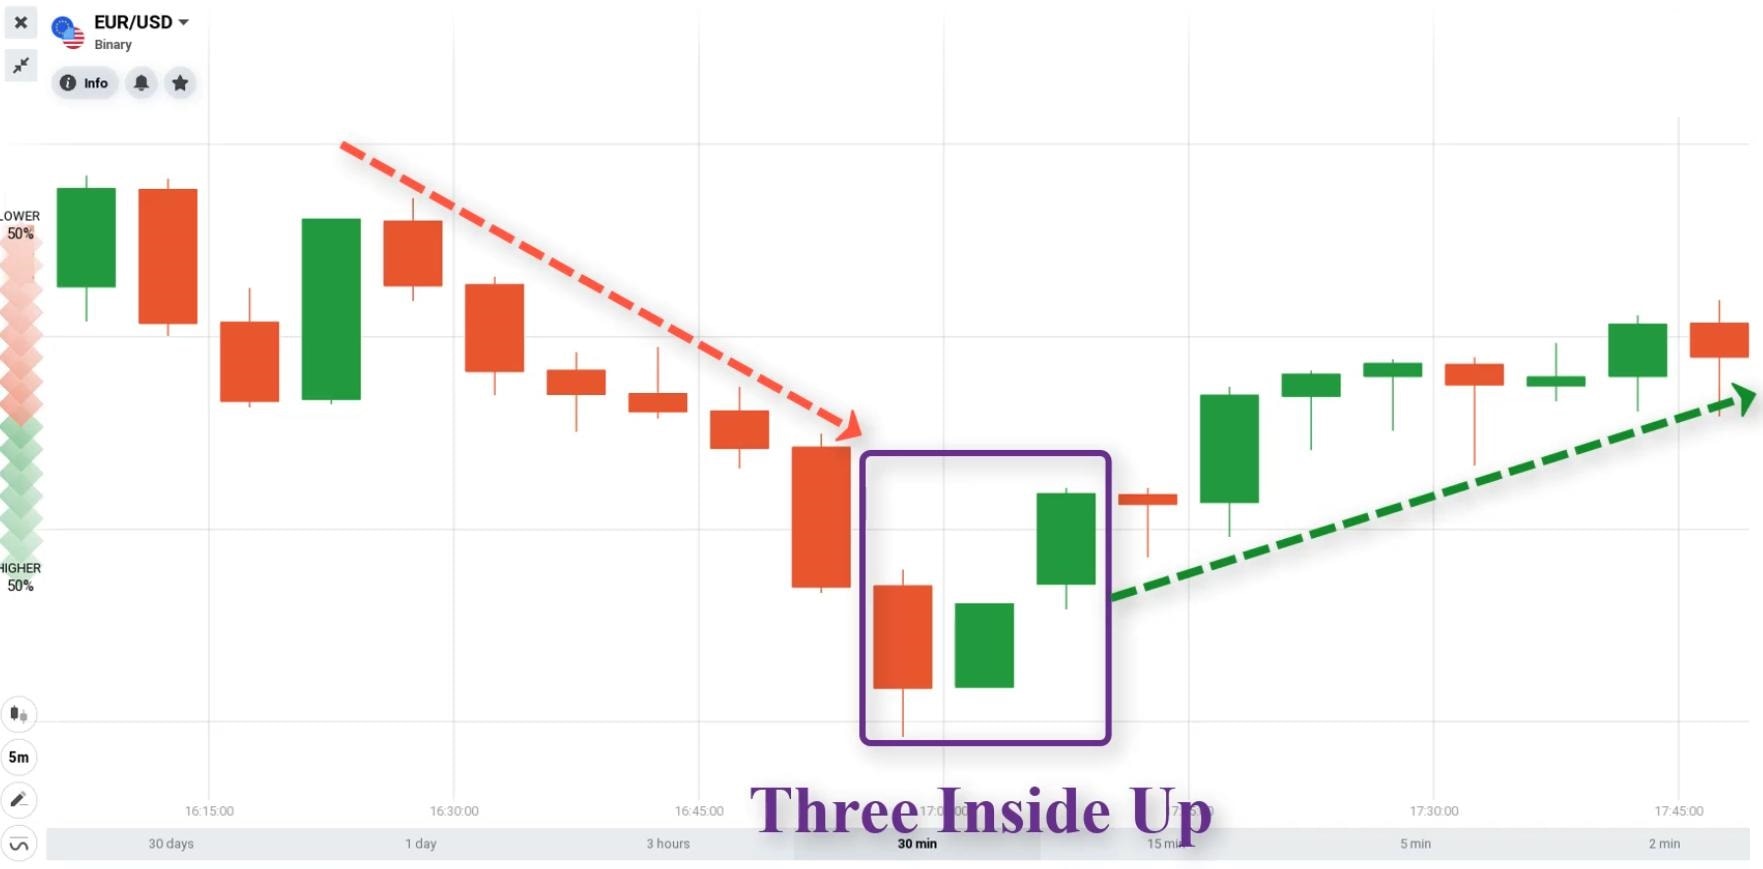
Characteristics of Three Inside Up candle
To identify a standard and high-probability Three Inside Up pattern on your chart, look for these specific criteria:
- 1st Candlestick: A long-body bearish (red) candlestick that continues the existing downtrend. This represents the final push from sellers.
- 2nd Candlestick: A smaller bullish (green) candlestick. Crucially, its real body must be completely contained within the real body of the first bearish candlestick (conforming to a Harami). Ideally, it should close near or above the 50% midpoint of the first candle.
- 3rd Candlestick: A strong bullish (green) candlestick that closes above the open (high of the body) of the first bearish candlestick. This confirms the reversal.
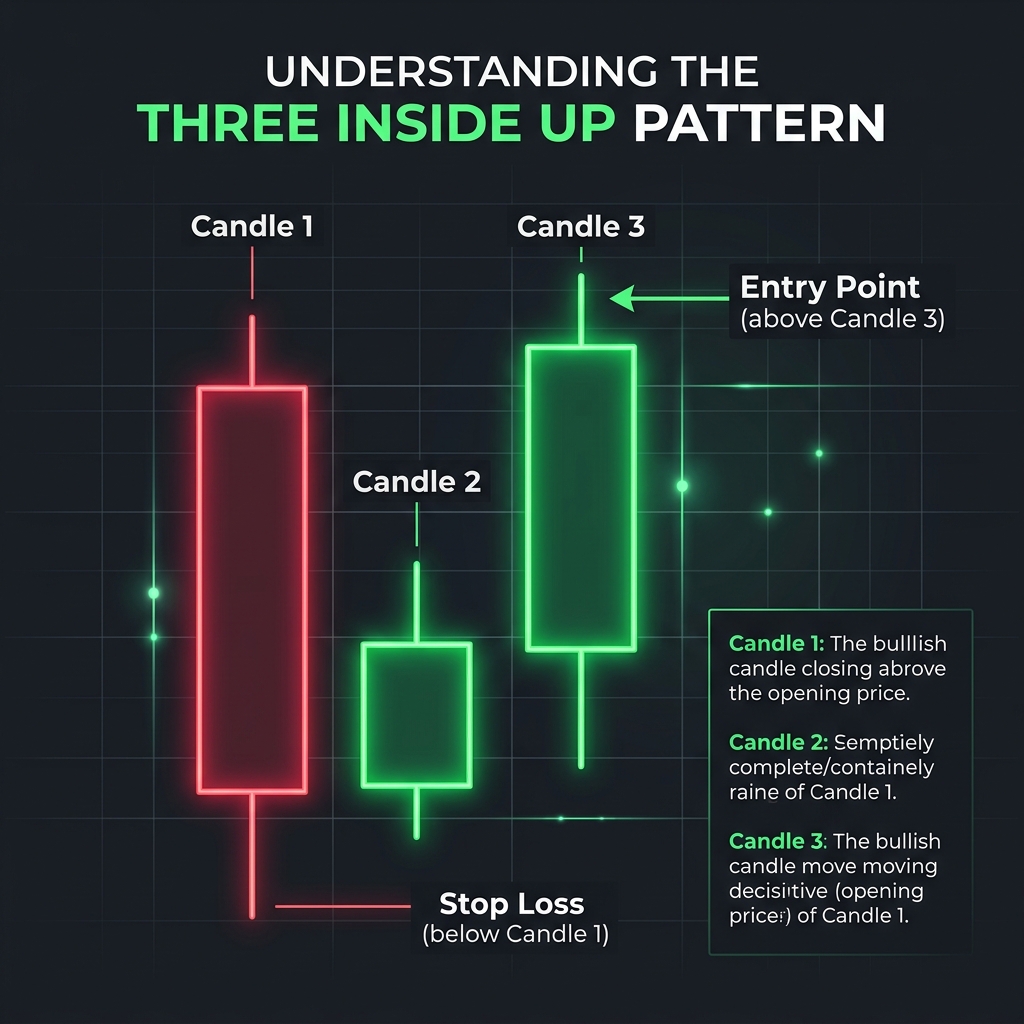
Market Psychology behind the pattern
This pattern represents a classic three-stage transition in market sentiment:
- On the first day (or candle), the bears are in complete control, pushing the price down to form a long bearish candle. This creates a climax of bearish sentiment.
- On the second day, buying pressure emerges. The price opens higher (or flat) and ends up closing higher. Because the body of the second candle is small and stays “inside” the first candle, it shows that the bears are no longer strong enough to keep pushing the price lower. Indecision sets in.
- On the third day, the bulls show their strength. Buyers push the price significantly higher, driving the close above the opening price of the first candle. This shows a complete transfer of power from sellers to buyers.

Variations of the Three Inside Up candlestick
In real trading, markets are rarely perfect. You will frequently observe variations that still carry the same trade logic:
- Shadow variations: The shadows (wicks) of the second candle can exceed the body of the first candle, but the real body must remain strictly inside.
- Body size variations: The second candle can be smaller or slightly larger, as long as it does not exceed the first candle’s open/close boundaries.
- Variation confirmation: As long as the third candle is a strong bullish green candle that closes above the first candle’s opening body level, the pattern is valid.

Three Inside Up vs. Three Inside Down
It is helpful to compare this pattern with its opposite counterpart to understand both sides of market reversals:
| Feature | Three Inside Up | Three Inside Down |
|---|---|---|
| Market Trend | Bottom of a Downtrend | Top of an Uptrend |
| 1st Candle | Long Bearish (Red) | Long Bullish (Green) |
| 2nd Candle | Small Bullish (Green) | Small Bearish (Red) |
| 3rd Candle | Strong Bullish (Closes above C1 open) | Strong Bearish (Closes below C1 open) |
| Signal Type | Bullish Reversal (Buy) | Bearish Reversal (Sell) |
How to trade with Three Inside Up: 2 High-Accuracy Strategies
To protect your capital and increase your winning rate, avoid trading the pattern in isolation. Instead, combine it with these indicators:
Strategy 1: Combine with Support Zones
When the price is in a downtrend and reaches a major Support zone, it has a high tendency to bounce back. The appearance of the Three Inside Up pattern right at this Support zone serves as our entry trigger.
- Chart setting: 5-minute Japanese candlesticks.
- Expiration time: 5 minutes (enter on the candle immediately following the pattern).
- Rule: Open an UP option only if the pattern completes at or just above the Support line.

Strategy 2: Combine with SMA30 indicator
The Simple Moving Average (SMA30) acts as dynamic Support. In a healthy uptrend, the price will frequently pull back to the SMA30 and bounce back up. A Three Inside Up pattern forming on the SMA30 confirms this bounce.
- Chart setting: 5-minute Japanese candlesticks + SMA30 line.
- Expiration time: 15 minutes or above (gives the trend more room to develop).
- Rule: Open an UP option when the price pulls back to the SMA30 and forms a Three Inside Up pattern directly on the SMA30 line.

Important rules when trading the pattern
- Do not trade in sideways markets: The Three Inside Up pattern is a reversal signal. If the market is moving sideways (consolidation), it will generate false signals.
- Wait for the close: Never enter a trade before the third candle closes. A last-second drop can turn a promising pattern into a failed signal.
- Analyze with volume: Ideally, the third bullish candle should have higher volume than the second candle, showing that buyers are putting real money behind the move.
- Practice on Demo accounts: Always test these strategies on a demo account on platforms like IQ Option or Olymp Trade before committing real capital.
Register an IQ Option account NowGet $10,000 Free for beginners
Frequently Asked Questions: Three Inside Up Pattern
What does the Three Inside Up pattern tell traders?
The Three Inside Up pattern tells traders that a bearish trend is losing momentum and buyers are stepping in to reverse the trend. It indicates a shift from selling pressure to buying pressure, providing a bullish entry signal.
How reliable is the Three Inside Up pattern?
The pattern is highly reliable when it forms at the bottom of a clear downtrend and near key Support levels or moving averages. However, like all indicators, its accuracy is significantly improved when combined with other indicators (like RSI or MACD) to confirm market momentum.
What is the difference between Morning Star and Three Inside Up?
While both are 3-candle bullish reversal patterns, the second candle of a Morning Star gaps down below the first candle (often a Doji or spinning top). The second candle of a Three Inside Up remains inside the real body of the first candle, forming a Harami.
Can I use this pattern for day trading?
Yes. The pattern works across all timeframes. For day trading, it is commonly used on the 5-minute, 15-minute, and 1-hour charts to spot intraday trend reversals.
About the Author
This trading guide was created by the How To Trade Blog analysis team. We specialize in demystifying Japanese candlestick configurations and technical analysis structures. Financial trading carries risk. Only risk capital you can afford to lose.