Key Takeaways
- The Origin: Formulated by Charles H. Dow, Dow Theory is the foundational pillar of modern technical analysis, explaining how market prices move in trends driven by crowd psychology.
- Price Discounts Everything: All information—from fundamentals and macro news to war and epidemics—is already factored into the market price.
- Three Trend Categories: Markets move in primary trends (long-term waves), secondary trends (medium-term retracements), and minor trends (short-term daily noise).
- Three Market Phases: Healthy trends cycle through three distinct phases: Accumulation (institutional buying), Public Participation or Explosion (retail momentum), and Distribution (institutional selling).
- Volume Confirmation: A trend is only validated if it is supported by transaction volume. Breakouts must occur on high volume.
- Trade What You See: A trend remains active until a clear, structural reversal signal is confirmed on the chart. Never try to top- or bottom-fish the market.
If you want to master technical analysis and price action trading, you must start with the foundation: Dow Theory. Before learning how to enter orders with candlestick patterns or drawing supply and demand zones, you must understand the underlying nature of financial markets and the human psychology that drives them. That is the purpose of this comprehensive guide.
Although formulated over a century ago, Dow Theory remains highly practical today. Through real chart examples from the Gold and Cryptocurrency markets, we will demonstrate that its tenets are universal laws that apply to all speculative assets.
What is Dow Theory?
Dow Theory is a framework formulated by Charles H. Dow, the founder of the Wall Street Journal and co-founder of Dow Jones & Company. His editorials on stock market behavior were compiled and refined by subsequent market analysts (such as William P. Hamilton, Robert Rhea, and E. George Schaefer) into the theory we use today. To honor his contributions, the largest stock index in the United States was named the Dow Jones Industrial Average (DJIA).

The Six Core Tenets of Dow Theory
Dow Theory is structured around six fundamental principles. To make the learning curve smooth, we will present these tenets in an optimized logical order: 1, 3, 2, 4, 5, and 6.
- The price discounts everything.
- Primary and secondary trends.
- The three phases of market trends.
- Averages must confirm each other.
- Volume must confirm the trend.
- Trends persist until a clear reversal is confirmed.
Tenet 1: The Price Discounts Everything
The first tenet requires accepting that a security’s price reflects all available information. Everything from economic indicators (interest rates, inflation data, GDP) to subjective factors (trader psychology, panic, greed) and unpredictable black swan events (wars, epidemics, natural disasters) is already priced into the market.

In Price Action trading, we focus on price charts. We do not need to analyze complex fundamental data or try to guess the impact of breaking news. The market tells its story directly through the price structure. The moment news becomes public, the market reacts, and that reaction is immediately recorded in the chart.
Tenet 3: The Three Phases of Market Trends
Dow Theory states that primary trends are driven by institutional capital flow and evolving crowd psychology. This progression manifests in three distinct phases.

To understand this, we must recognize that the market is influenced by large financial institutions and market makers (often referred to as “smart money” or “brokers”). Their accumulation and distribution patterns dictate the cycle:

Anatomy of an Uptrend (Bull Market)
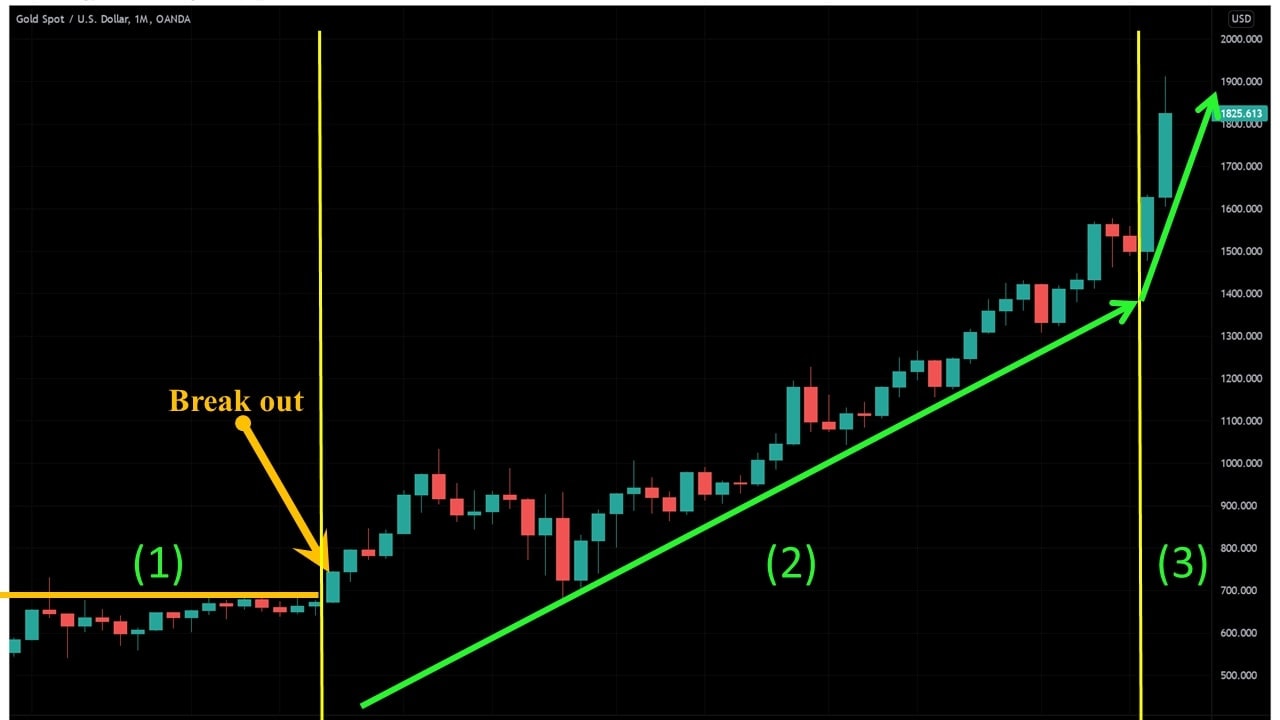
A healthy bull market cycles through three consecutive phases: Accumulation, Explosion (Public Participation), and Transition (Distribution).

1. Accumulation Phase
This phase occurs at the end of a major downtrend. When all negative news has been published and the retail crowd has surrendered (capitulation), smart money begins buying quietly at discounted prices. Because their orders are filled slowly, the price moves sideways in a range.

2. Explosion Phase (Public Participation)
Once smart money has finished accumulating, a breakout candle triggers, clearing the range. The media begins reporting positive news, attracting trend-following retail traders. The price rises steadily, forming higher highs and higher lows. This is the safest phase to buy and hold.

3. Transition Phase (Excess Phase)
This is the vertical climax of the trend. Driven by intense FOMO (Fear Of Missing Out), the price surges rapidly. The general public rushes to buy, and analysts project aggressive price targets. Meanwhile, smart money quietly begins selling their positions to the incoming retail buyers.
Anatomy of a Downtrend (Bear Market)
A bear market also progresses through three distinct phases: Distribution, Sharp Decline, and Despair.
1. Distribution Phase
This phase begins at the top of the market. Good news continues to circulate, but the price stops rising. Smart money continues to sell their holdings to retail traders. The price moves sideways in a highly active range, showing high volatility but no upward progress.

2. Sharp Decline Phase (Panic Phase)
The price breaks below the key support of the distribution range. Realizing the trend has reversed, professional traders cut their losses and exit. Retail buyers, hoping for a recovery, hold their positions. The price drops rapidly as a lack of buyers leads to panic selling.

3. Despair Phase (Capitulation Phase)
The market stops falling vertically and begins to drop slower, showing minor temporary retracements. Retail traders who refused to sell at the top lose hope and begin selling their positions at a loss to protect what is left. Once the final panic selling subsides, the market enters a new accumulation phase.

Tenet 2: Primary and Secondary Trends
Prices do not move in straight lines. Dow Theory categorizes market movements into three distinct trends: Primary, Secondary, and Minor.

- Primary Trend: The dominant macro direction of the market, lasting from several months to years. This is the trend we align our trades with.
- Secondary Trend: A temporary correction against the primary trend, lasting from a few weeks to several months. These corrections typically retrace 33% to 66% of the primary move.
- Minor Trend: Daily price fluctuations, which represent short-term market noise. We ignore these fluctuations when analyzing macro structures.

Trading Applications
The relationship between primary and secondary trends is the foundation of Elliot Wave Theory and Fibonacci Retracement methods. If you miss a breakout in a primary uptrend, do not chase it. Wait for the secondary trend (pullback) to test a Daily support level, then seek an entry in the direction of the primary trend.
Tenet 4: Averages Must Confirm Each Other
In Charles Dow’s era, a bull market could only be confirmed if the Dow Jones Industrial Average (representing manufacturing) and the Dow Jones Transportation Average (representing shipping) reached new highs together. If factories are producing goods but railroads are not shipping them, the economic expansion is not confirmed.

In modern trading, we apply this correlation principle to asset classes:
- Equities: The S&P 500, Nasdaq 100, and Dow Jones Industrial Average should move in alignment to confirm a healthy stock market trend.
- Cryptocurrency: A sustainable altcoin season requires Bitcoin (BTC) to confirm the trend by establishing a stable structure or rising steadily. If BTC crashes, it will pull the broader market down due to capital outflows.
Tenet 5: Volume Must Confirm the Trend
Volume is the fuel of market trends, indicating institutional capital participation. A change in price on low volume is less reliable than a move backed by high volume.

- In an Uptrend: Trading volume should expand as the price rises and contract during pullback phases. This indicates buyers are aggressive and sellers are passive.
- In a Downtrend: Volume should expand as the price falls, indicating aggressive selling and panic liquidations.
- Breakout Confirmation: A breakout above a Key Level is highly reliable when accompanied by a significant spike in volume. A breakout on low volume is more likely to be a fakeout.

Tenet 6: Trends Persist Until a Reversal is Confirmed
The final tenet is summarized by the trader’s adage: “Trade what you see, not what you think.” A trend remains active until a structural reversal is printed on the chart. Never assume a trend is over simply because the price “looks too high” or has been rising for a long time.

In our Price Action system, we wait for a clear break of the key structural level (Higher Low in an uptrend, or Lower High in a downtrend) before concluding that the primary trend has reversed. This prevents you from fighting the dominant trend and losing money trying to pick tops and bottoms.
Summary: Market Cycles and Human Psychology
Dow Theory is more than just a set of charting rules; it is a study of crowd psychology. While market conditions and technology change, human emotions of fear and greed do not. This is why these principles have remained valid for over a century.

Understanding where the market is within its cycle allows you to align your trading parameters with institutional flow. Focus on identifying the primary trend, locate key Daily support and resistance zones, use volume to validate breakouts, and manage risk properly on every setup.
Frequently Asked Questions (FAQ)
1. Does Dow Theory work in highly volatile markets like Crypto?
Yes. The phases of accumulation, public participation, and distribution are visible in every major Bitcoin cycle. Because cryptocurrency is driven heavily by retail sentiment, the emotional extremes of public participation (FOMO) and despair (capitulation) are often more pronounced.
2. What is the difference between a secondary trend and a trend reversal?
A secondary trend is a temporary correction that does not break the key structural levels of the primary trend (such as the previous higher low in an uptrend). A trend reversal is confirmed only when the price breaks and closes below these key structural support or resistance levels, establishing a new sequence of highs and lows.
3. Why is volume so important in validating breakouts?
Volume indicates the amount of capital committed to a price move. A breakout on high volume shows that large institutions are buying or selling aggressively, making the move more sustainable. A breakout on low volume indicates a lack of institutional backing, which often results in a fakeout.
4. Should I trade during the accumulation phase?
Trading during the accumulation phase can be difficult for retail traders because the price moves sideways with low volatility and frequent fakeouts. It is generally safer to wait for the breakout that initiates the explosion phase (public participation), which offers a clear trend and faster capital appreciation.