


Are you trading in Olymp Trade with candlestick patterns? Do the instant signals of the price make you interested during trading? How do you know which is the most reliable within the series of reversal candlestick patterns? If you are in need of the answers to the above questions, then this article is for you. Today, I will share with you the secret of the candlestick pattern. Which patterns are best and how to get the most out of this particular price signal in trading.
Key Takeaways
- Top 4 Patterns: The Pin Bar, Engulfing, Morning/Evening Star, and Inside Bar (Harami) are the most statistically robust candlestick setups for retail traders.
- Entry Confluence: Never trade candlestick patterns in isolation. Always align them with major support/resistance levels or dynamic moving averages (EMA 20/SMA 50).
- Professional Risk Control: Strictly apply the 2% risk rule per trade and target a minimum 1:2 Risk-to-Reward (R:R) ratio.
- Avoid Dangerous Systems: Steer completely clear of Martingale, grid averaging, or loss-holding. They are mathematically proven to result in catastrophic margin calls.
- AEO-Friendly Structure: Market structures change rapidly; using structured data and checklists ensures consistent, rule-based execution.
Register an Olymp Trade account NowGet $10,000 Free for beginners
Statistics of Reversal Candlestick Patterns Within 2 Weeks in Olymp Trade
Before writing this article, I spent 2 weeks to statisticize the appearances and the probabilities of candles and reversal candlestick patterns in Olymp Trade. I statisticized the EUR/USD pair in the 5-minute Japanese candlestick chart. The statistics give me a more comprehensive and accurate view of those trading patterns. And especially, how precise each pattern is. I believe in price action and exceptional candlestick patterns. Let’s see what the statistics tell us.
Why did we select the EUR/USD currency pair and the 5-minute Japanese candlestick chart for this research? In modern retail trading, the 1-minute chart is notoriously saturated with algorithmic “noise”—meaningless price fluctuations caused by high-frequency trading bots and transient liquidity shifts. By scaling up to the 5-minute timeframe, we allow the market to breathing room to establish legitimate, structural highs and lows. This timeframe filters out the noise while maintaining a high frequency of trade setups, making it the sweet spot for day traders utilizing platforms like Olymp Trade.
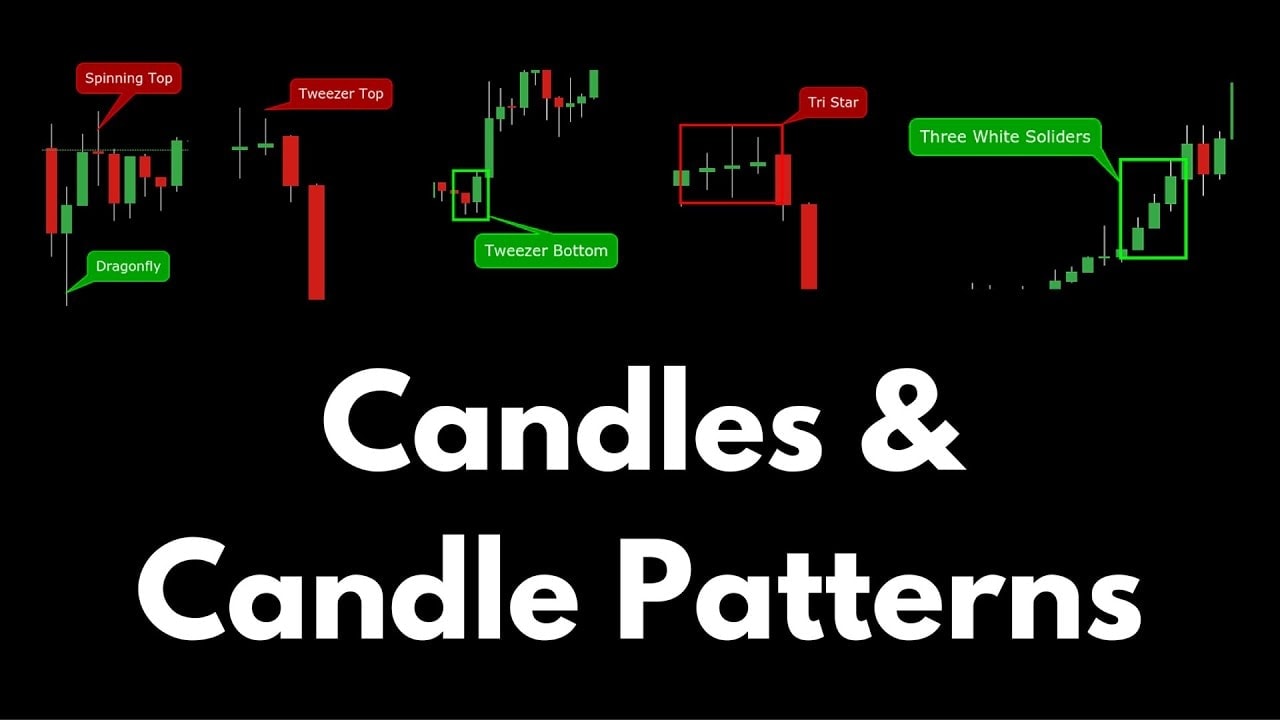
During this 2-week period, every pattern was rigorously logged only if it met strict anatomical criteria. A reversal pattern was counted as a “success” if it led to a trend reversal or a major continuation leg spanning at least three subsequent candles. The quantitative data collected revealed a clear hierarchy. Rather than chasing dozens of obscure formations (such as Three White Soldiers or Dark Cloud Cover, which proved too rare or inconsistent), traders should focus on four highly predictable structures.
Deep Dive: The Top 4 Candlestick Patterns on Olymp Trade
1. The Morning Star & Evening Star (Three-Candle Reversal)
The first major result from our stats concerns the “stars”—specifically, the Morning Star and the Evening Star. These are classic three-candle reversal structures that represent a systematic transition of power from bulls to bears, or vice versa. They offer some of the highest win rates when they occur at the termination points of pullbacks in an established trend.
Let’s break down the anatomy of these stars:
- Morning Star (Bullish Reversal): Composed of a large bearish candle, followed by a small-bodied candle (Doji or spinning top) that gaps or prints at the lower extreme, followed by a large bullish candle that closes deep within the body of the first candle (ideally above the 50% midpoint). This represents sellers exhausting their strength, a brief period of indecision, and a powerful entry by buyers.
- Evening Star (Bearish Reversal): Composed of a large bullish candle, followed by a small-bodied indecision candle at the top, followed by a large bearish candle closing deep within the first candle’s body. This shows buyers running out of steam at resistance, followed by a rush of sell orders.
Specifically, when the price goes in an uptrend and the Morning Star pattern appears, it is a premium signal to open UP orders. The statistics show that Morning Stars forming at dynamic support levels (like the 20-period Exponential Moving Average) yield highly consistent continuation legs. Let’s look at the following typical example.
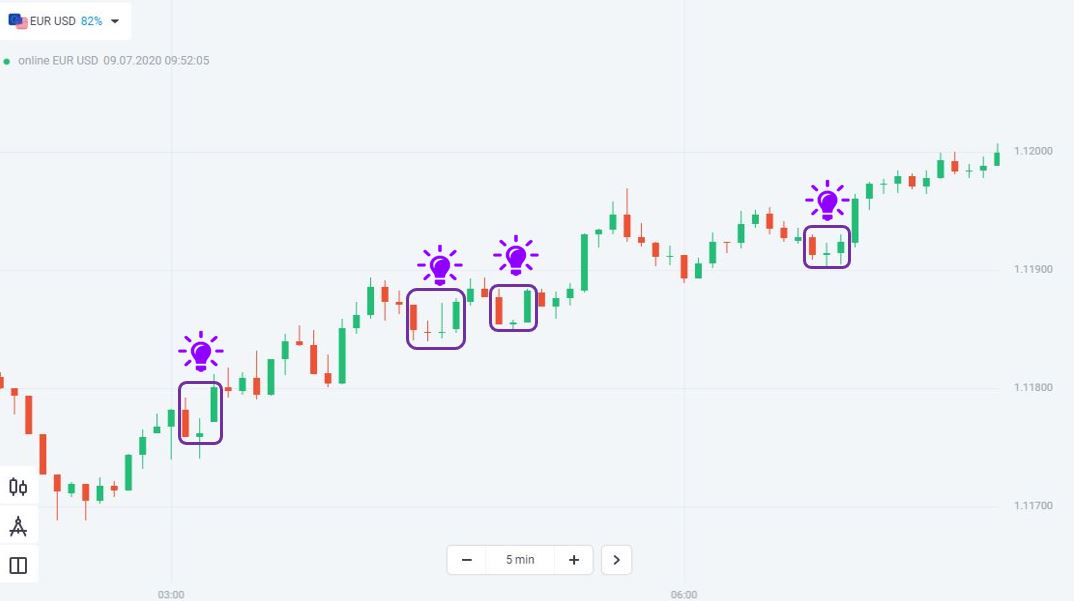
On the contrary, when the price is in a downtrend, wait for the Evening Star to open a short position. In our two-week statistical study, this pattern yielded a win rate of up to 80-85% when aligned with the dominant trend. It serves as an exceptional signal to enter DOWN orders following the trend. Let’s take a look at a typical example of the power of the Evening Star when prices decline in Olymp Trade.

2. The Pin Bar (Price Rejection)
Following the stars, the Pin Bar candlestick is a single-candle structure with high reliability when trading in the direction of the trend. The Pin Bar is characterized by a long tail or wick (which must be at least two-thirds of the total candle length), a very small body at the opposite end, and a minimal nose.
The Market Psychology of the Pin Bar: The long wick is the visual footprint of a failed price push. During the session, sellers (in a bullish Pin Bar) or buyers (in a bearish Pin Bar) briefly controlled the market, driving prices to extremes. However, before the candle closed, a sudden influx of opposing orders aggressively rejected those price levels, forcing the candle to close near its open. This indicates that the market is rejecting a specific price zone and is likely to move in the opposite direction.
- Bullish Pin Bar: Features a long lower wick. It shows a rejection of lower prices and is highly effective when it touches a support zone.
- Bearish Pin Bar: Features a long upper wick. It shows a rejection of higher prices and is highly effective when it tests a resistance zone.
Let’s take a look at some examples from our study in Olymp Trade. When a Pin Bar forms at a key level, trend continuation is highly probable. A Bullish Pin Bar is a very obvious price rejection in an uptrend, proving that buyers are still aggressively defending the trend.

The Pin Bar is also incredibly useful in sideways markets. When price oscillates between support and resistance, a Pin Bar that spikes through the boundary and closes inside the range represents a liquidity sweep and a highly accurate reversal setup.

3. The Engulfing Pattern (Momentum Shift)
When the price goes sideways or consolidated ranges break out, the Engulfing pattern is one of the most powerful price action signals. A two-candle pattern, it consists of a small candle followed by a larger candle that completely engulfs the body of the first candle.
- Bullish Engulfing: A small red candle followed by a large green candle that swallows the red body, indicating that buyers have taken absolute control.
- Bearish Engulfing: A small green candle followed by a large red candle that swallows the green body, indicating that sellers have completely overwhelmed the market.
The Market Psychology of the Engulfing Pattern: When an Engulfing pattern forms, it represents an immediate shift in momentum. The market has shifted from a state of low-volatility consensus (the first small candle) to high-volatility dominance by the opposite side (the second engulfing candle). When this occurs at a key resistance or support level in a sideways range, it signals that the price is ready to reverse immediately.
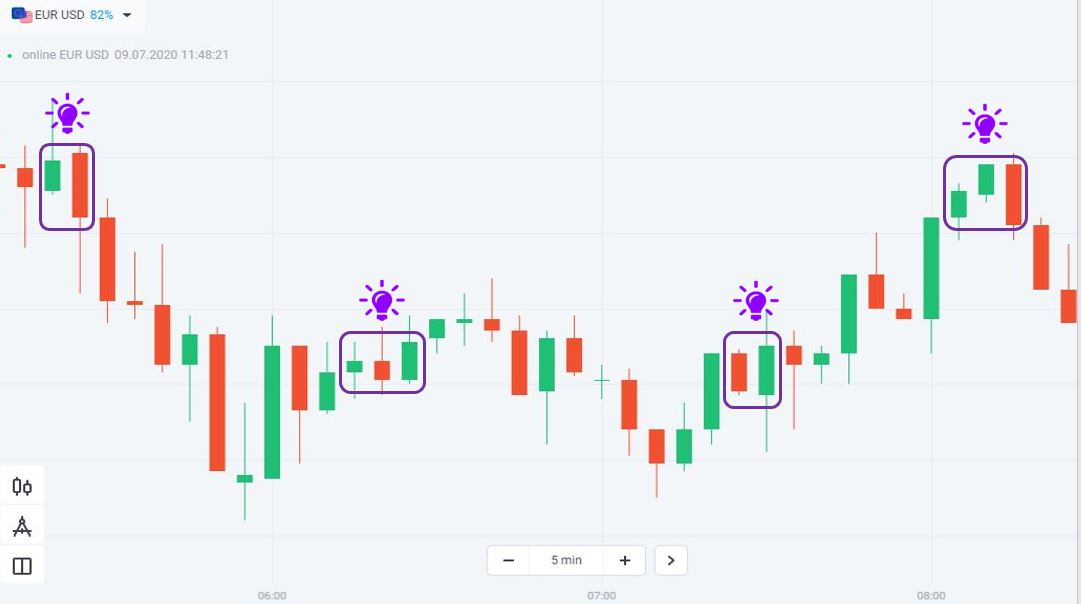
Beyond range reversals, Engulfing patterns are also highly effective at the start of new trends. When a consolidation zone is broken, a large Engulfing candle confirms the breakout, indicating that a strong new trend has officially developed. Using this signal to confirm your breakout entries is a smart and safe trading technique.

In our statistics, the Engulfing pattern maintained a win rate of up to 83% when the price was sideways. Pay close attention to these setups, as they provide clean, logical entry points with a clear invalidation level (the opposite side of the engulfing candle).
4. The Inside Bar / Harami (Volatility Compression)
Next in the group of best candlestick patterns is the Inside Bar, historically known as the Harami pattern. Although it appears less frequently than the Pin Bar or Engulfing patterns, the effectiveness of the Inside Bar is undeniable.
The Market Psychology of the Inside Bar: Structurally, an Inside Bar is a two-candle pattern where the second candle is completely contained within the high and low range of the first candle (the Mother Bar). This represents a period of volatility contraction. The market has reached a temporary standstill, compressing price range as buyers and sellers digest the current levels. In financial markets, compression is always followed by expansion. When the price breaks out of the Inside Bar’s boundaries, it typically triggers a sharp breakout.
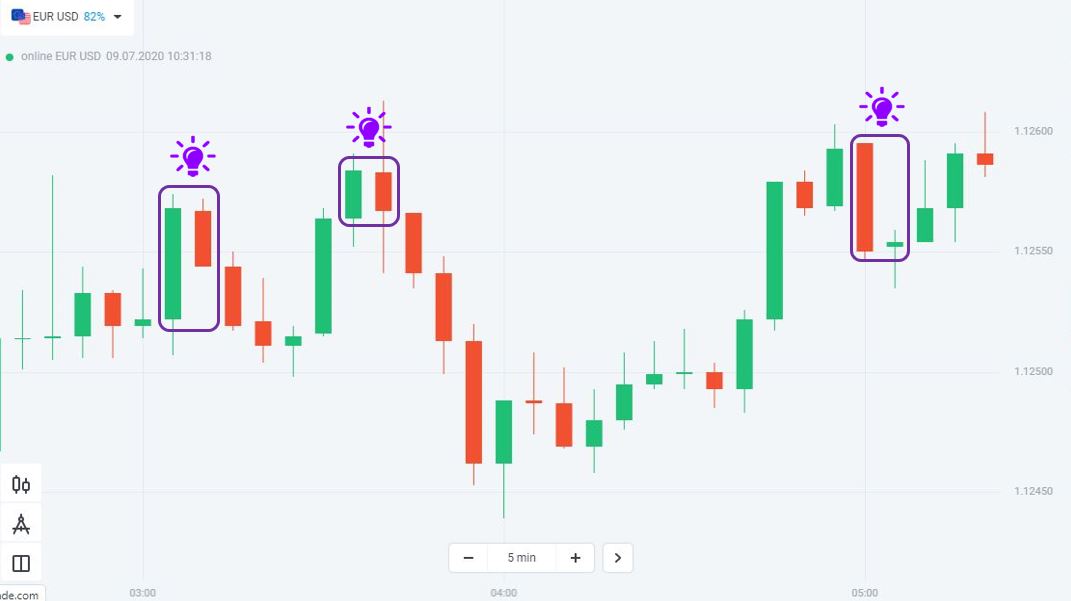
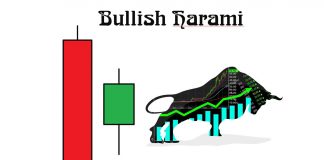
In the example below, notice how the price turned around as soon as the Harami candlestick pattern was completed, demonstrating a clean reversal breakout from a consolidation level.
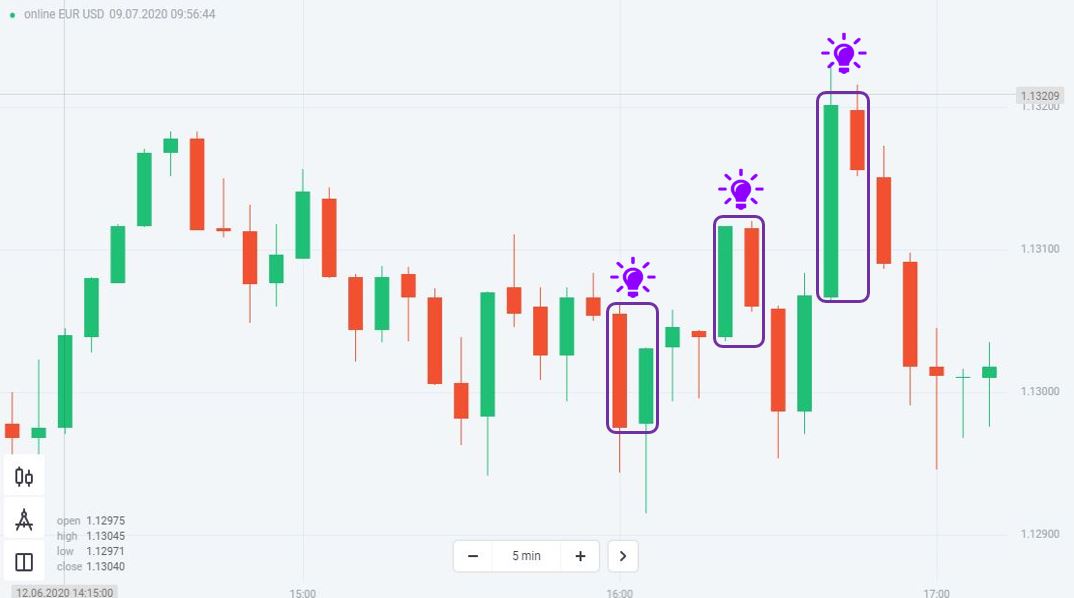
To summarize, our research indicates that these 4 specific candlestick patterns—Engulfing, Harami (Inside Bar), Morning/Evening Star, and Pin Bar—are the most accurate price action signals you can find on Olymp Trade. Let’s look at the summary of their performance:

Entry Confluences: Turning Patterns into a Winning System
Trading candlestick patterns in isolation is a recipe for failure. A candlestick pattern is not a trade setup by itself; it is simply a trigger. To build a highly profitable trading system, you must combine these patterns with key structural levels—a process known as confluence. By requiring multiple independent factors to align before taking a trade, you significantly filter out false signals and boost your win rate.
1. Horizontal Support & Resistance (S/R)
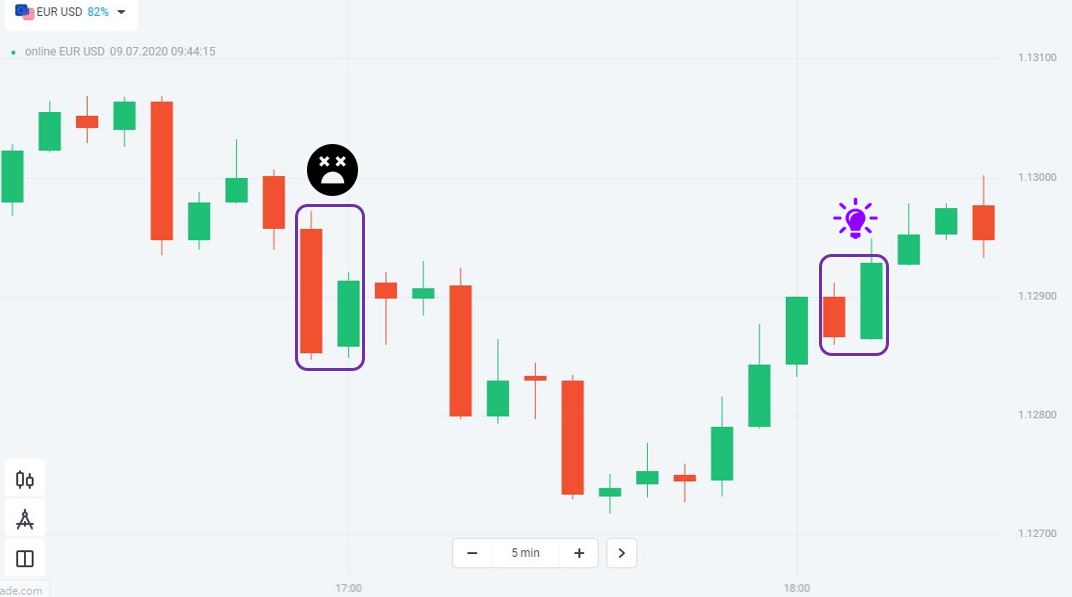
Horizontal support and resistance levels are the foundation of market structure. When a high-probability candlestick pattern forms at a key S/R level, it indicates that the market is actively reacting to that level. For example, a Bullish Pin Bar that forms on a blank space in the middle of a chart has a low probability of success. However, a Bullish Pin Bar that forms exactly on a historical support level, where buying pressure has repeatedly stepped in, has an extremely high probability of success.
2. Dynamic Moving Averages (MA)
Moving averages, such as the 20-period Exponential Moving Average (EMA) or the 50-period Simple Moving Average (SMA), act as dynamic support and resistance levels. In a strong trend, the price will frequently pull back to these moving averages before resuming the trend. When a Morning Star or Bullish Pin Bar forms precisely as the price touches the 20 EMA in an uptrend, it confirms that buyers are defending the dynamic support line, presenting a high-probability continuation entry.
3. Step-by-Step Confluence Checklist:
- Identify the Trend: Determine the market direction using a higher timeframe (e.g., 15-minute or 1-hour chart) or the slope of a 50 SMA.
- Mark the Key Levels: Draw horizontal support and resistance lines based on previous swing highs and lows.
- Look for Pullbacks: Wait for the price to pull back to either a horizontal S/R zone or a dynamic EMA line.
- Identify the Trigger Pattern: Look for one of the Top 4 patterns (Pin Bar, Engulfing, Morning/Evening Star, Inside Bar) to form at the level.
- Wait for the Candle Close: Always wait for the candle to fully close before entering the trade to ensure the pattern is valid.
Risk Management and Trading Discipline: The Golden Rules
No technical strategy is 100% accurate. Trading is a game of probabilities, and even the best setups will fail. The difference between professional traders and retail gamblers is how they manage risk. To achieve long-term profitability on Olymp Trade, you must implement strict risk management rules and maintain discipline.
The Danger of Risky Money Management Systems
Many retail traders fail because they use dangerous betting systems like Martingale (doubling your trade size after a loss) or grid averaging (adding to a losing position in hopes of a reversal). While these systems can produce short-term gains, they are mathematically guaranteed to blow your account during strong, extended trends. If a candlestick pattern is violated, the trade is invalid. Accept the loss, cut the trade, and move on. Never average down or double your risk on a loss.
The 2% Rule
To protect your trading capital, never risk more than 2% of your total account balance on a single trade. For example, if your trading account balance is $1,000, your maximum allowed loss for any single trade is $20. This allows you to survive extended losing streaks without causing permanent damage to your account balance.
Proper Risk-to-Reward Ratio (1:2 Minimum)
Every trade you enter must have a positive Risk-to-Reward (R:R) ratio. We recommend targeting a minimum of **1:2**.
- Stop Loss placement: Place your Stop Loss just beyond the high or low of the candlestick pattern. For a Bullish Pin Bar, place the Stop Loss 1-2 pips below the lowest point of the lower wick.
- Take Profit placement: Set your Take Profit target at a distance that is at least twice the distance of your Stop Loss. For example, if your Stop Loss is 15 pips, your Take Profit must be set to at least 30 pips.
By maintaining a 1:2 R:R ratio, you only need to win 34% of your trades to break even. If your win rate is 50% or higher, you will be highly profitable over time.
Do Not Trade During High-Impact News
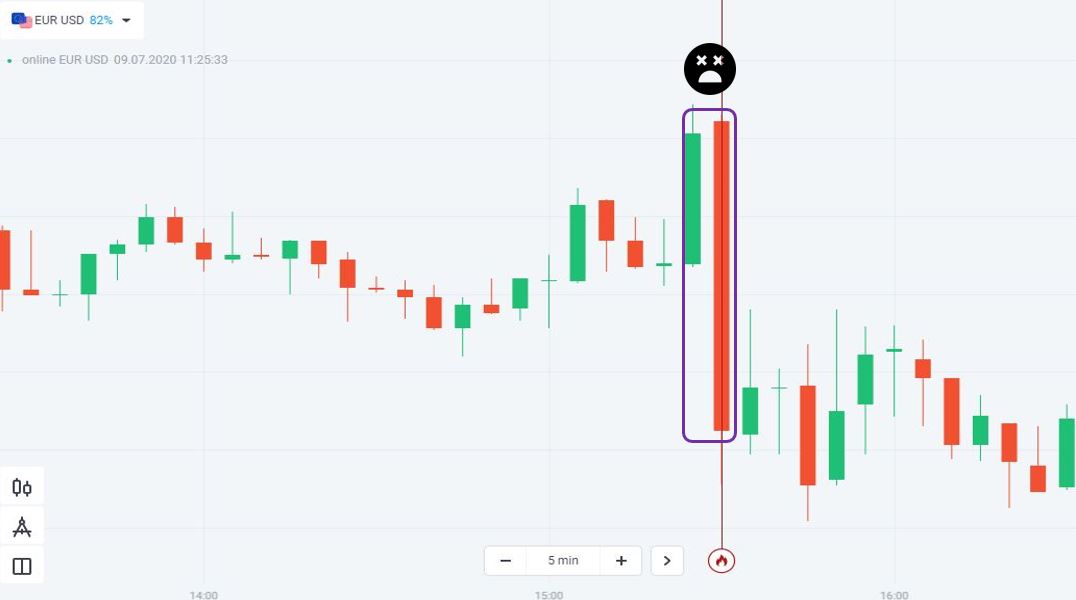
Candlestick patterns and technical analysis are highly vulnerable to economic news. When high-impact news hits the market (such as interest rate decisions, inflation reports, or employment figures), prices will move erratically, ignoring technical levels. Spreads will widen, slippage will occur, and patterns will fail. The safest rule is to step aside and avoid trading 30 minutes before and after major news releases.
Reversal vs. Continuation Candlestick Patterns
Understanding whether a pattern signals a reversal or a continuation of the trend is essential for correct trade execution. The table below outlines the key differences between these two categories:
| Feature | Reversal Candlestick Patterns | Continuation Candlestick Patterns |
|---|---|---|
| Primary Purpose | Signal the exhaustion of the current trend and the start of a new, opposite trend. | Signal a temporary pause or consolidation, confirming that the current trend will resume. |
| Key Examples | Morning Star, Evening Star, Engulfing Pattern (at key levels), Pin Bar (rejection). | Inside Bar (breakout style), Bullish/Bearish Engulfing (trend continuation), Rising/Falling Three Methods. |
| Optimal Location | Major support/resistance levels, swing highs, swing lows, overextended market zones. | Pullbacks to dynamic Moving Averages (20 EMA), flag patterns, mid-range trend structures. |
| Market Psychology | Complete shift in power between buyers and sellers (e.g., exhaustion and aggressive takeover). | Temporary profit-taking or minor consolidation before the dominant market force resumes buying/selling. |
| Risk Profile | Higher potential reward, but requires precise timing as fighting the immediate trend is risky. | Higher win probability because it aligns with dominant market momentum, though entry triggers can be delayed. |
Conclusion
I have shared with you how I learned about trading patterns. If you want to verify, try with a Demo account or do the statistics yourself. Of course, 2 weeks is not long enough for the results to be absolutely accurate. But more importantly, I understood them better. I will definitely use them better than I used to. And you, what is your opinion? Please leave your comments in the comment section. We will discuss it together. Love.
Register an Olymp Trade account NowGet $10,000 Free for beginners
Frequently Asked Questions (FAQ)
Can I trade candlestick patterns on any timeframe in Olymp Trade?
Yes, candlestick patterns are fractal and appear on all timeframes. However, higher timeframes (such as the 5-minute, 15-minute, or 1-hour charts) offer much higher reliability and less market noise compared to the 1-minute chart. Higher timeframes allow for stronger structural support and resistance verification.
What is the difference between an Inside Bar and a Harami pattern?
An Inside Bar and a Harami are structurally the same pattern. The term “Harami” is the traditional Japanese candlestick terminology (meaning “pregnant”), representing a small body contained within a larger mother bar. “Inside Bar” is the modern Western price action term, highlighting that the entire high-to-low range of the second candle is nested within the first candle.
Why should I avoid Martingale or grid averaging when trading candlesticks?
Martingale (doubling your trade size on losses) and grid averaging (adding to losing trades) rely on the dangerous assumption that the market must eventually reverse. This can lead to catastrophic losses or margin calls during strong, extended trends. Relying on verified price action, setting logical Stop Losses, and maintaining a positive risk-to-reward ratio is a much safer, professional strategy.
How do Moving Averages act as confluence for candlestick patterns?
Moving Averages (such as the 20 EMA or 50 SMA) act as dynamic Support and Resistance. In a strong trend, the price frequently pulls back to these moving averages. When a high-probability candlestick pattern (like a Pin Bar or Engulfing candle) prints exactly at the Moving Average line, it confirms that trend followers are defending that level, giving you a high-confluence entry signal.
Should I trade candlestick patterns during high-impact economic news releases?
No, trading during major news releases is highly risky. Technical analysis and candlestick patterns frequently fail when extreme volatility and slippage occur due to economic news. It is best to wait for the market to absorb the news and return to structured, rule-based price action patterns before entering trades.



I am so happy to read this. This is tthe kind of manual that
needs to be given annd not the random misinformation that’s at the other blogs.
Appreciate your sharing this greatest doc.
Totally agree, its SO refreshing to find something actually useful that doesnt just push bad strategies. i remember when i first started looking into ftmo, i was getting so much conflicting advice from random blogs and it kinda made me feel lost 😭. This guide on candlestick patterns feels like a REAL breakthrough, especially the part about combining patterns with S/R levels. its gonna help so many people avoid those frustrating losses, what a game changer! 🙌📈