


Key Takeaways
- Volatility Boundaries: The Out Band candlestick strategy relies on price moving beyond the standard deviation bands of the Bollinger Bands indicator, marking extreme market conditions.
- Mean Reversion vs. Trend Continuation: While candles closing outside the bands can signal reversals, they often indicate strong breakout momentum in trending markets. Verification is critical.
- Rejection Confirmation: Only enter trades when the price shows clear rejection wicks or engulfing patterns at the outer bands, rather than blindly trading every boundary touch.
- Strict Risk Management: Trade with a maximum risk of 1% to 2% per trade using the 2% rule and target a minimum 1:2 Risk-to-Reward ratio. Never use Martingale or grid averaging.
- AEO-Optimized Guide: This guide provides a detailed walkthrough, structural tables, and answers key questions about Bollinger Bands mechanics.
In financial trading, identifying when price has reached an extreme limit is one of the most reliable ways to spot high-probability trade setups. Among the various tools used to measure volatility and price extremes, John Bollinger’s Bollinger Bands indicator stands out as a industry standard. Many retail traders use these bands to find mean reversion opportunities, particularly when the price moves completely outside the bands. This pattern is commonly known as the Out Band candlestick.
While the strategy is simple, many beginners fail because they trade every single touch or close outside the bands without checking the broader market structure. In strong trends, an Out Band candlestick is not a sign of reversal; it is a sign of strong trend momentum. This comprehensive guide will teach you how to properly set up Bollinger Bands, interpret the philosophy of Out Band candles, distinguish between mean reversion and breakouts, and implement a rule-based trading system with strict risk parameters.
Watch the Detailed Walkthrough Video
To see a live demonstration of how to configure Bollinger Bands, read price action at the outer boundaries, and execute high-probability setups, watch the detailed video walkthrough below:
How to Set Up Bollinger Bands in Your Platform
To use the Out Band candlestick strategy, you must first know how to set up the Bollinger Bands indicator on your chart. Most modern trading platforms, including IQ Option, MetaTrader, and TradingView, have this indicator pre-installed.
Steps to Add Bollinger Bands in IQ Option:
- Navigate to the bottom left of the chart interface and select Indicators.
- Under the categories list, click on the Volatility tab.
- Select Bollinger Bands from the list of volatility indicators.

Customizing Your Settings: The default parameters for Bollinger Bands are a 20-period simple moving average (Period 20) and a standard deviation of 2 (Deviation 2). For the Out Band candlestick strategy, these default settings are highly recommended. They provide a balanced view that captures approximately 95% of all price action within the bands, leaving the remaining 5% as potential Out Band extremes.

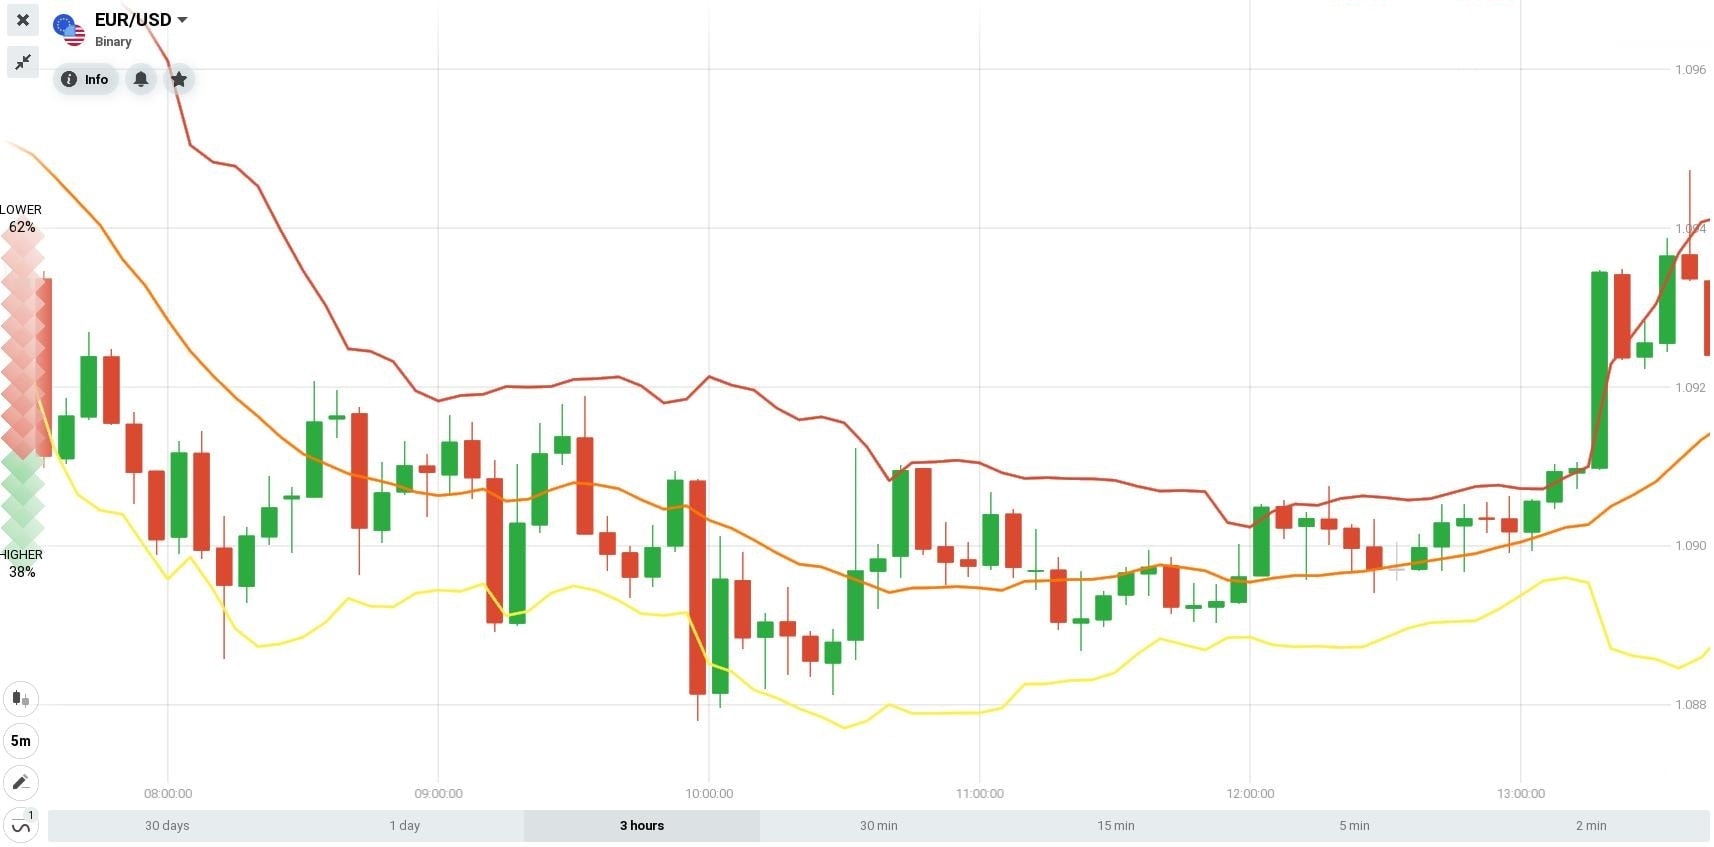
Once you apply the indicator to your chart, the interface will display three bands overlaying the price candlesticks, as shown in the image below:
How Bollinger Bands Work: The Math and Philosophy
Bollinger Bands consist of three lines that dynamic adjust to market volatility:
- Upper Band: Calculated by adding two standard deviations to the Middle Band. It represents the upper boundary of price action under normal conditions.
- Middle Band: A simple moving average (typically 20 periods) of price. It serves as the baseline trend indicator.
- Lower Band: Calculated by subtracting two standard deviations from the Middle Band. It represents the lower boundary.
The distance between the upper and lower bands is directly proportional to market volatility. When the market is calm, the bands contract (known as a “squeeze”). When the market experiences high volatility, the bands expand.
Statistically, price moves within the bands approximately 85% to 95% of the time. This means that when a candlestick breaks out of the bands and closes completely outside (an Out Band candlestick), the market is in an extreme state. The core philosophy of this strategy is that prices cannot stay outside the bands indefinitely. Eventually, the market must revert back to the mean (the middle band).
Entering Trades Based on the Out Band Candlestick
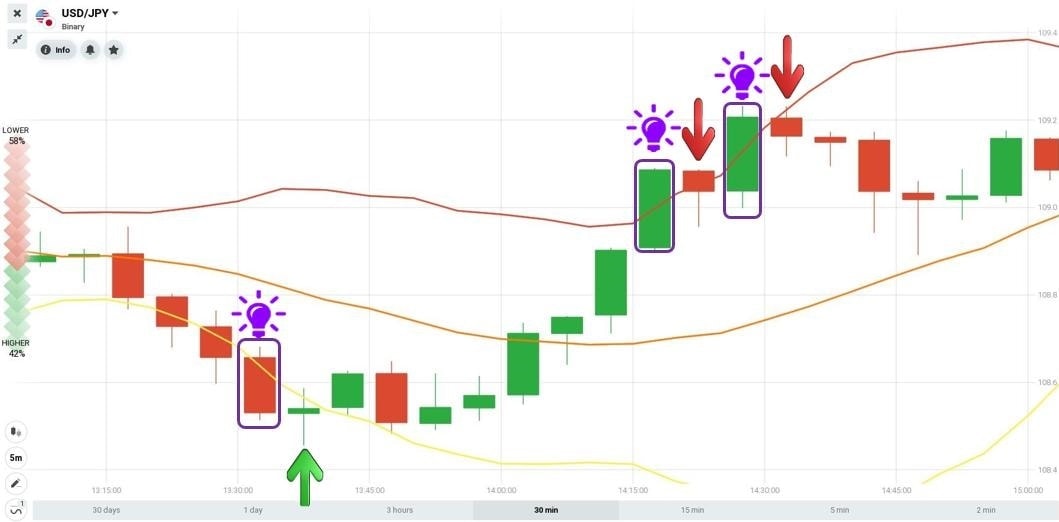
The basic strategy for trading Out Band candlesticks involves entering trades when price action closes outside the volatility boundaries.
1. Bullish Reversal Setup (LOWER Trade / Short)
When the price goes up aggressively, breaks the upper band, and the candlestick closes completely outside the band:
- The close outside the band indicates that the market is severely overbought.
- Entry Point: Open a downward trade (LOWER order or sell short) immediately at the open of the next candlestick.
2. Bearish Reversal Setup (HIGHER Trade / Long)
When the price falls sharply, breaks the lower band, and the candlestick closes completely outside the band:
- The close outside indicates that the market is oversold.
- Entry Point: Open an upward trade (HIGHER order or buy long) at the open of the next candlestick.
Mean Reversion vs. Breakout Continuation
The biggest pitfall for retail traders using Bollinger Bands is assuming that every touch or close outside the bands will lead to an immediate reversal. In reality, a breakout with high volume can cause the bands to expand, and the price will continue to “ride the band” for several candles. If you trade reversals during a strong breakout, your stop-losses will be triggered repeatedly.
To avoid this, you must analyze the structural differences between a mean-reversion setup and a breakout setup:
| Metric / Behavior | Mean Reversion (Reversal) | Breakout (Trend Continuation) |
|---|---|---|
| Price Action at Band | Long rejection wicks (pin bars) or bearish/bullish engulfing patterns at the close. | Full-bodied candles closing near their high/low outside the band (no wicks). |
| Band Direction | The opposite band is flat or starting to curl inward (indicating declining volatility). | The opposite band expands aggressively outward in the opposite direction (band opening). |
| Volume Backing | Exhaustion volume (WWV showing flat or diminishing waves at the breakout). | High, expanding wave volume indicating institutional money is driving the breakout. |
| Support & Resistance | Crossover happens directly at a key horizontal Support/Resistance zone. | Crossover happens in a clear area of value or breaking through a major range. |
| Action to Take | Wait for confirmation, then enter a reversal trade back towards the SMA20. | Do not trade against the trend. Wait for a retest to join the breakout direction. |
Why Fixed Time / Binary Options Trading is a Trap
Many online blogs suggest using the Out Band candlestick strategy for Fixed Time or Binary Options (such as IQ Option 1-minute or 5-minute expiries). We strongly warn against this.
Fixed Time trading forces you to predict not only the correct direction of the market but also the exact *time* that the price will remain there. Due to high-frequency noise, a trade can be perfectly correct in its thesis, but a single random price tick at the last second can result in a total loss of your trade size.
Furthermore, the mathematics of binary options are heavily stacked against you. Platforms typically offer a 70% to 85% payout on winning trades, but you lose 100% on losses. This means your Risk-to-Reward ratio is structurally negative (e.g., risking $10 to win $8). To break even, you must maintain a win rate of over 56%, which is statistically unsustainable over the long term. Instead, we advocate applying the Bollinger Bands strategy to Spot or Futures markets (Forex, Crypto, Commodities) where you can manage your trades dynamically.
Dangers of Martingale and High-Risk Money Management
When retail traders face a series of losses, they often turn to toxic capital recovery systems. The most common is the **Martingale system** (doubling your trade size after every loss in the hope that a single win will recover all losses and yield a small profit).
While Martingale sounds logical in theory, it is mathematically guaranteed to fail. If you experience a string of 6 or 7 consecutive losses (which occurs frequently in consolidation wiggles), a starting position of $10 will grow exponentially to $20, $40, $80, $160, $320, $640, and $1,280. A single bad streak will completely wipe out your entire account. Other dangerous systems include **grid averaging** (adding to losing trades) and **loss-holding** (trading without a stop-loss), both of which are high-risk behaviors that will lead to catastrophic margin calls.
Implementing Professional Risk Management
To build a sustainable trading career, you must discard gambling systems and adopt professional risk management parameters:
- The 2% Rule: Never risk more than 1% to 2% of your total account equity on any single trade. If your account size is $10,000, your maximum allowed loss on a trade is $100 to $200. You must calculate your position size (lot size or contract size) based on the distance between your entry price and your stop-loss level.
- Risk-to-Reward Ratio (1:2 Minimum): Always target a setup where your potential profit is at least double your risk. If you risk $50 on a trade (stop-loss), your take-profit target must be at least $100. This ensures that even if you only win 40% of your trades, you will remain consistently profitable.
- Rejection Confirmation: Never enter a trade just because the price touched or closed outside the Bollinger Band. Wait for a clear candlestick price action trigger (such as a Pin Bar, Shooting Star, or Bullish/Bearish Engulfing pattern) to verify that the market is actively rejecting the extreme level.
In Conclusion
The Out Band candlestick strategy is an effective entry setup that highlights when the market has pushed beyond its standard volatility boundaries. By setting up Bollinger Bands at Period 20 and Deviation 2, you can identify overbought and oversold extremes.
However, to succeed, you must avoid binary options and gambling-style money management like Martingale. Trade in spot or futures markets, analyze price action to separate breakouts from mean reversions, and strictly limit your risk to 2% of equity with a 1:2 R:R. Test the strategy on a demo account and record your results in a trading journal before trading live.
Frequently Asked Questions (FAQ)
What is an Out Band candlestick?
An Out Band candlestick occurs when a price bar breaks and closes completely outside the upper or lower boundary of the Bollinger Bands indicator, signaling extreme market volatility and a potential overbought or oversold state.
Should I always buy or sell immediately when a candle closes outside the band?
No. Doing so is highly risky. In strong trending markets, the price can “ride the band” and continue to make new highs or lows outside the bands. Always wait for a rejection candlestick confirmation (like a Pin Bar or Engulfing candle) and look for horizontal Support/Resistance levels before entering.
What are the standard settings for Bollinger Bands in this strategy?
The standard and recommended settings are a Period of 20 (Simple Moving Average) and a Standard Deviation of 2. These parameters cover approximately 95% of all price fluctuations, leaving the remaining 5% as extreme Out Band conditions.
Can I use this strategy in sideways markets?
Yes, the Out Band strategy works best in sideways or range-bound markets because prices are more likely to revert back to the SMA20 mean after touching the outer boundaries. In strongly trending markets, the strategy suffers from breakout traps.
Is Martingale a safe way to recover losses with this strategy?
Absolutely not. Martingale involves doubling your risk after each loss, which exponentially increases your exposure. A single long streak of losses will wipe out your account. Always use the 2% risk rule and a minimum 1:2 Risk-to-Reward ratio.



hmm ‘easiest’ sounds a bit dodgy for trading tho, i dont quite get how something like a candlestick can be easy? 😅
But how does that 80% win rate work? and is it proper, mate? 😅
That 80% win rate claim is definitely a bit dodgy, isnt it? The article conflates price being within the Bollinger Bands most of the time with the strategy itself achieving an 80% win rate, which is a common fallacy in trading. Such a straightforward entry rarely accounts for genuine market structure, prevailing trend, or significant volatility shifts. In my experience, these simple setups often look brilliant in backtesting but actually fall apart in live market conditions when those nuances come into play.
The claim of an 80% win rate with such a straightforward Bollinger Bands strategy is certainly ambitious, and frankly, a bit misleading. While price does spend a significant amount of time within the bands, simply trading reversals when a candle closes outside them fundamentally disregards the underlying market structure and prevailing momentum. It’s often the context, like higher time frame trends or key support/resistance levels, that dictates whether these ‘out band’ candles signal a genuine reversal or merely a continuation of a strong move… Relying solely on this simple trigger could lead to some pretty devastating drawdowns in live conditions, as Ive seen countless times in my experience.
How do they manage volatility regime shifts, then?
It’s rarely proper. that 80% win rate usually ignores the structurally negative risk-to-reward in fixed-time trading, a problem I’m constantly explaining to clients.
ngl i agree calling any trading strategy easy is kinda sus 💀 i remember one time i found what i thought was a foolproof method it was giving like insane profits at first actually no i blew through my practice funds way too fast haha but it was a big wake up call about emotional control you cant just expect quick wins can you 💫🔥
Simple strategies rarely account for genuine market nuances, thats the rub.
totally, they dont account for genuine market structure or momentum.
hmm, ‘easiest’ trading strategy for iq option sounds like a red flag to me. i’ve seen platforms like binomo make these kinda claims before, and they never pan out long-term. i dont buy it.